December 19, 2019
Improve Debugging Efficiency with LLDB

Overview
LLDB is a software debugger used by the LLVM project, such as the Clang expression parser and LLVM disassembler.
LLDB is the default debugger for Xcode on Mac OS and supports debugging C, Objective-C, C++, and Swift on Desktop machines, iOS devices and simulators.
For most Mac and iOS developers, LLDB is the most commonly used debugging tool besides Xcode interface breakpoint debugging. The most commonly used command is the po command. For example:
1(lldb) po self.view▿ Optional < UIView >
po prints information about an object. Because the po command is commonly used, many developers’ cognition of LLDB hinges on it, and the powerful functions of LLDB as a debugger do not get full play.
Let’s dive into the powerful functions of LLDB.
Basic usage
This article is only for Mac developers. LLVM is installed along with Xcode by default, so the installation of the LLDB program will not be introduced here.
1. Start and Exit
You can start the LLDB debugger when you type the lldb command through the console, or add breakpoints to debug and trigger through Xcode. Such as
1 2 3➜ $ lldb (lldb)
Exit the LLDB debugger through the quit command, such as
1 2 3➜ $ lldb (lldb) quit➜ $
2. help command - view the list of supported commands
After starting the LLDB debugger, type the help command to view the list of supported commands, which is very convenient for daily use tips. For example
1 2 3 4 5 6 7 8 9➜ $ lldb (lldb) help Debugger commands: apropos--List debugger commands related to a word or subject. breakpoint--Commands for operating on breakpoints(see 'help b' for shorthand.) ....
Use help <command> to view a detailed description of a command. For example
1 2 3 4 5 6 7 8 9 10 11 12 13(lldb) help breakpoint Commands for operating on breakpoints(see 'help b' for shorthand.) Syntax: breakpoint The following subcommands are supported: clear--Delete or disable breakpoints matching the specified source file and line. command--Commands for adding, removing and listing LLDB commands
3. Commonly used commands
The commonly used commands of LLDB are basically abbreviated. For example, to view the list of breakpoints, you can use the command breakpoint list or br list.
Here is a table with the most commonly used commands.
Command | Abbreviated command | Description | Input Example | Output Example |
expression <expr> | ex <expr> | Execute expression in current thread | ex 1+1 | (Int) $R0 = 2 |
expression -O – | po | Describe the output in the specified language’s API | po self.view! | <UIView: 0x7f86d1d02020; frame = (0 0; 375 812); autoresize = W+H; layer = <CALayer:0x6040002353a0>> |
expression – | p | Print primitive type information | p self.view! | (UIView?) $R7 = 0x00007fda43f999a0 { UIKit.UIResponder = { ObjectiveC.NSObject = {} } } |
breakpoint | br | Breakpoint List | br list | Current breakpoints: 1: file = ‘/hidePath/AppComponent/WebViewController/WKUIDelegateBase.swift’, line = 30, exact_match = 0, locations = 1, resolved = 1, hit count = 0 … |
Remove breakpoint | br delete 1 | |||
Enable breakpoint, if no breakpoint no. is passed, then all breakpoints are enabled | br enable 1 | |||
Disable breakpoint, if no breakpoint no. is passed, then all breakpoints are disabled | br disable 1 | |||
Set breakpoint on the function name. | br set -n viewDidLoad | Breakpoint 9: 35 locations. // Breakpoints are set for related functions | ||
continue | c | Exit the breakpoint and continue running | ||
thread step-over | next or n | Execute the next line of code | ||
thread step-inst | si or s | Step into the code of the function | ||
thread step-out | finish | Step outside the current code range. | ||
thread backtrace | bt | Display stack information for the current thread | * thread #1, queue = ‘com.apple.main-thread’, stop reason = step over frame #0: 0x0000000105970a12 frame #1: 0x0000000105970dd4 | |
type look | ty l | View type definition | ty l Equatable | protocol Equatable { static func == (lhs: Self, rhs: Self) -> Swift.Bool } |
frame variable | fr v | Variables for the current stack frame | ||
fr v foo | Display the contents of the foo variable | |||
thread jump | Set the program counter (PC) to the new address, Count from the current line, skip 1 line of code | thread jump --by 1 |
Note the expression command requires “primitive expression” input. If you use any command options, you must use – character between the end of the command option and the beginning of the original input.
If you use Xcode, the convenient interface operation will not help you memorize these LLDB commands. But if you can memorize the commonly used commands, it helps you debug in the console.
Here are some shortcuts of the Xcode console to speed you up.
Shortcut | Description |
⎇ + ← or ⎇ + → | Move left or right in words |
⎇ + ⌫ | Delete in words |
⌘ + k | Clear console |
When the input box is blank, press ⏎ | Execute the previous command |
↑ or ↓ | Display the previous or next command |
Useful tips
1. Use .lldbinit file to customize operation habits
You can add a series of common LLDB commands to the .lldbinit file, which will be executed every time the LLDB debugger is started. Here are the steps:
1 2# Switch to user directory➜ $ cd~ # Create.lldb file and modify permissions➜ $ touch.lldbinit➜ $ chmod + x.lldbinit
You can add some re-used commands to the .lldbinit file, such as disabling breakpoints for the creation and release of memory. This can help reduce unnecessary interruptions during debugging. Such as
1(lldb) br set - n malloc - N memory(lldb) br set - n free - N memory(lldb) br disable memory
When you need to debug related memory, you can re-enable it in the LLDB prompter by
1
2
(lldb) br en memory
2 breakpoints enabled.
An important concept used in the above tips is naming breakpoints. Passing -N <name> allows us to give a series of breakpoints an easy-to-remember name for subsequent calls. The memory allocation and deallocation are both named memory so that we can operate this series of breakpoints at any time.
Also, there is another file ~/.lldbinit-Xcode, which stores the configuration that is valid only for the LLDB inside Xcode. But I personally recommend using the .lldbinit file because it is more universal.
2. Use conditional breakpoints to improve the debugging efficiency
Each version of Xcode strives to improve its compilation and running speed. However, for a larger mature project, each debugging still takes too much time. Hence, making full use of LLDB breakpoints, reducing the number of compilation and running times will be very helpful to improve the debugging efficiency.
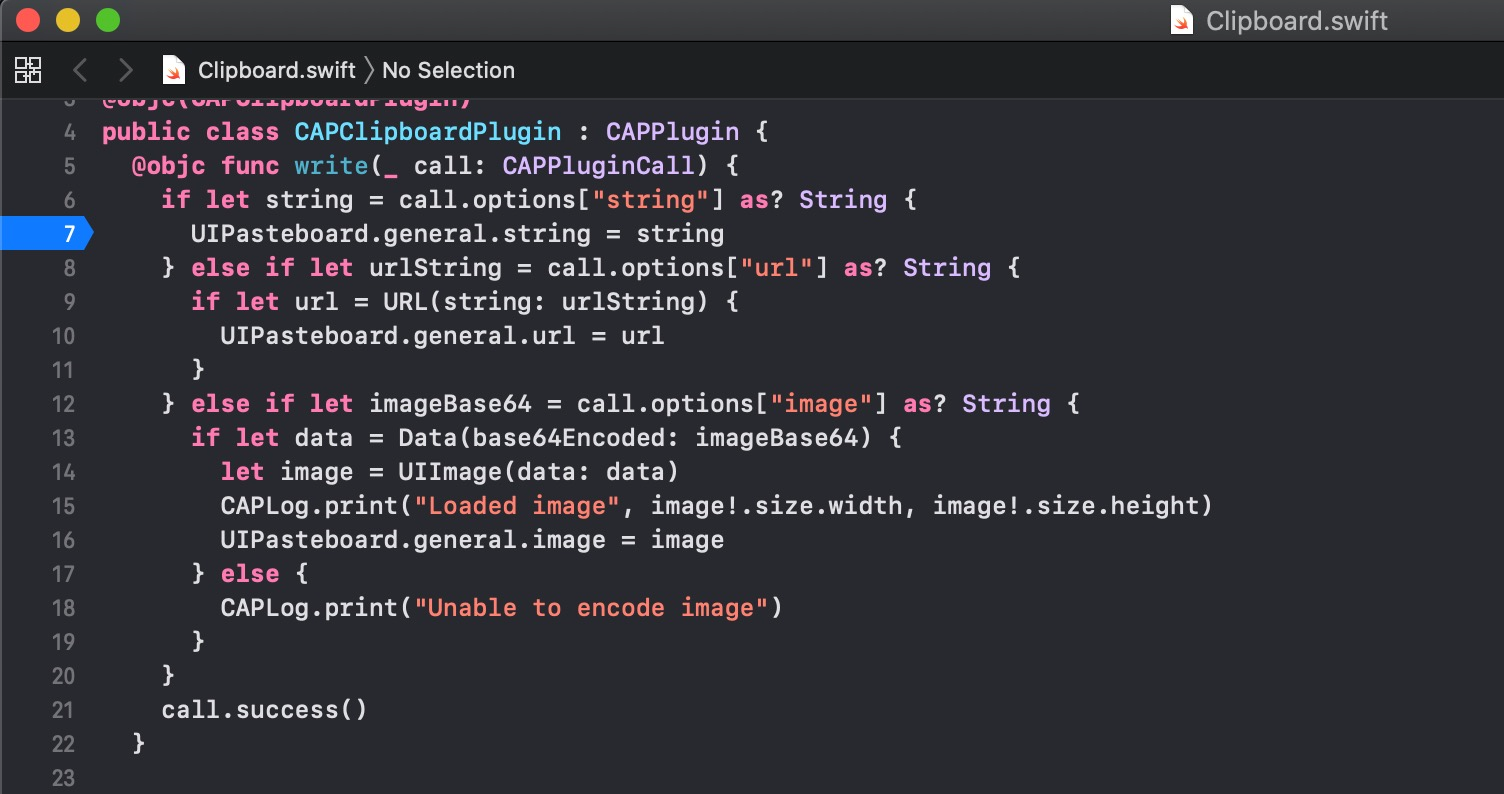
Adding a breakpoint in Xcode is very simple. Just click the corresponding line number on the right side of the code editor to add a breakpoint to that line. For example,

The operation is equivalent to br set -f Clipboard.swift -l 7.
Clipboard.swift is the file name where the code is located in the above screenshot.
It’s also very simple to delete the breakpoint in Xcode. Drag the breakpoint and move it away.
Now take the clipboard as an example to see how to use the conditional breakpoint to improve debugging efficiency. The general function description is as follows:
The application needs to obtain the content from the clipboard of the mobile phone, and the application determines whether the user needs to perform the next operation according to the content of the clipboard, such as replacing to a certain module. Also clear out more of the content.
The function is simple, but in the actual debugging I found that I needed to copy a piece of content each time before going down, because the clipboard will be emptied each time. If you modify the code, add a line of code UIPasteboard.general.string = “BATBA3PILN8LPL7A” before each execution, which can avoid the problem of the need to replicate the code everywhere.
But there are two issues:
We have to recompile the entire project.
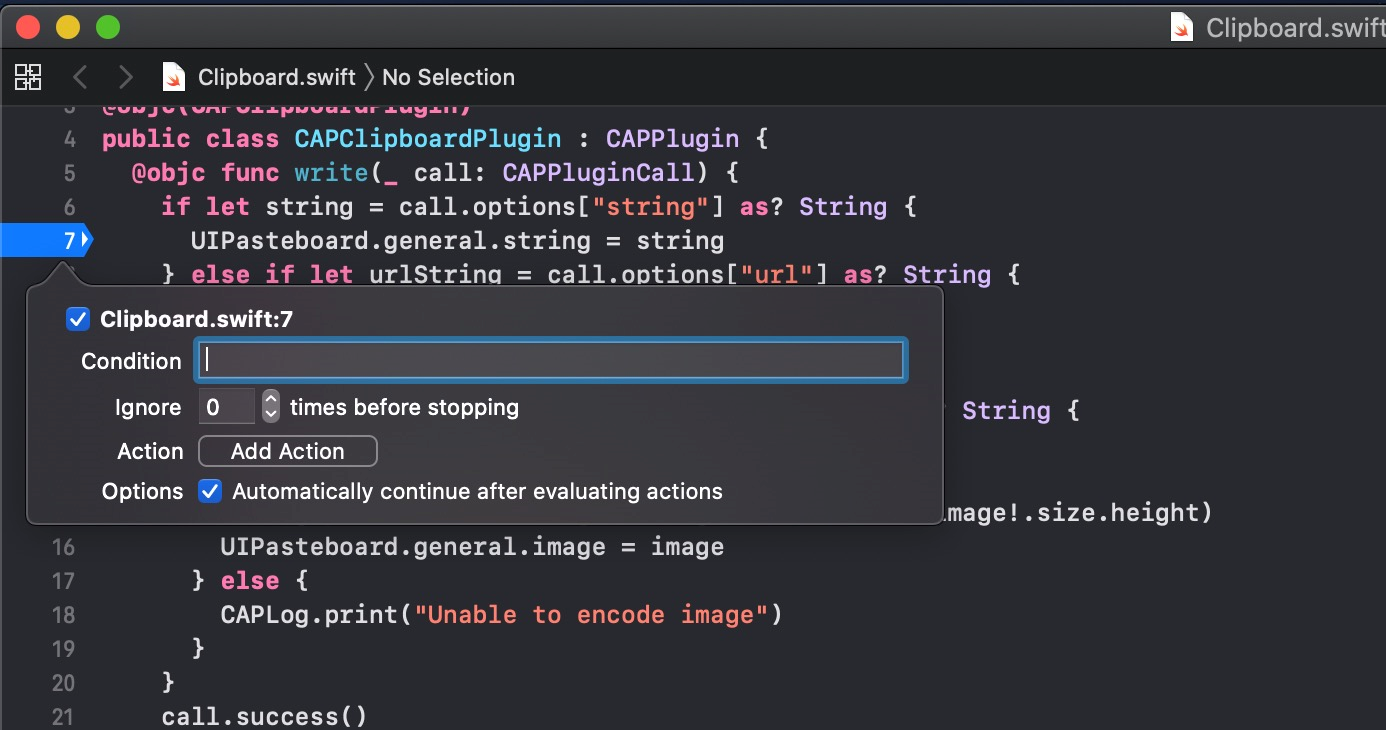
It changed the logic of the original code. If we forget to delete the line of code afterwards, it will introduce a bug!To resolve these issues, the conditional breakpoint can help. Double-click the breakpoint, (the blue arrow in the figure), and the following popup window will appear:

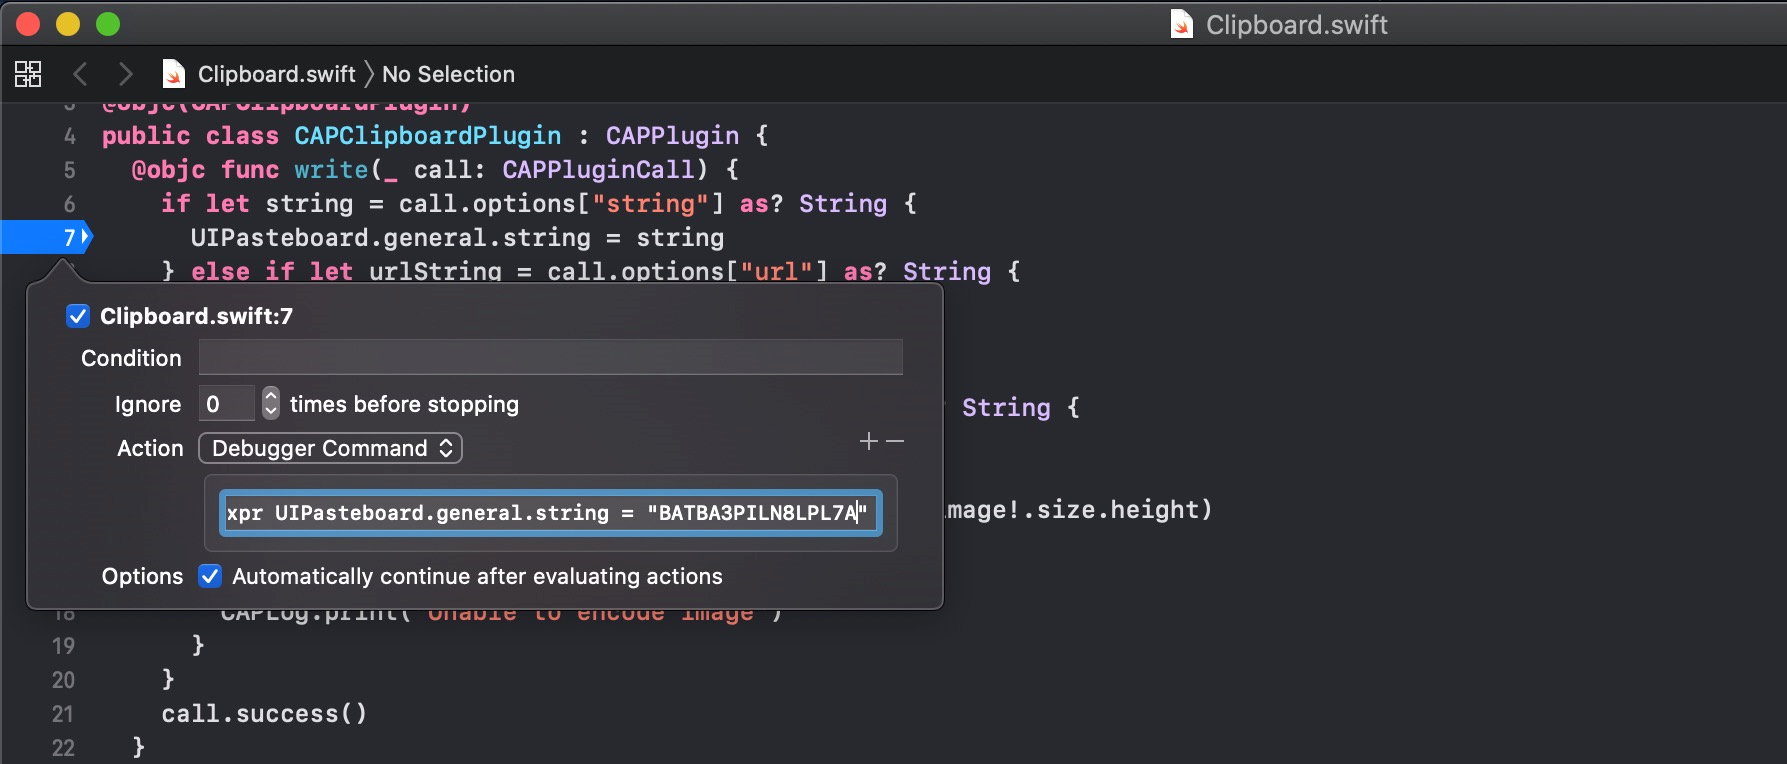
Click on the “Add Action” button, and then select the Debugger Command, enter expr UIPasteboard.general.string = “BATBA3PILN8LPL7A” code, and select the “Automatically continue after evaluating actions” option. If this option is not selected, the debugger will stop at this breakpoint every time.

In this way, each time it reaches the breakpoint, it will be assigned to the clipboard first for debugging, but it will not affect the original logic, and does not need to recompile the entire project.
3. Use CATransaction.flush to refresh the view elements in real time
CATransaction.flush is a function in the Core Animation library. Its purpose is to flush any existing implicit transactions. By default, it is automatically called at the end of the current runloop and does not need to be called manually. Therefore, if you change the page view content during breakpoint debugging, it will not be directly displayed on the screen, because the current runloop is not over. At this time, by manually refreshing, you can easily debug the visual elements. For example, when you need to fine-tune the position of a certain picture, if you modify and run the code every time it will be very inefficient. But with the help of the LLDB debugger you can greatly improve efficiency. The following example illustrates how to adjust the position of an image.
First use the Xcode Debug View Hierarchy function to enter the page debugging process. It can be accessed by clicking the Debug View button in the Xcode debug bar.
After entering the View Debug interface, through the wireframe, find the constraint elements that need to be adjusted.
The constraint marked by the red box at the top is the object we want to adjust. Use the shortcut key ⌘ + ⇧ + D to locate the debugging window.
After selecting, copy the element ⌘ + C, Xcode will automatically convert the element content, and use the po command output to view the content as follows:
1
2
(lldb) po((NSLayoutConstraint * ) 0x60c0004a6240) <
  NSayoutConstraint: 0x60c0004a6240 @LoginEntryViewController.swift #38 UIImageView: 0x7fb8676befd0.top = = UIView: 0x7fb867652b70.top + 80.0 >
Here you can see that the constraint value of top is 80. Use the expression command to modify the value and change it to 0. The code is as follows:
1
2
3
(lldb) e((NSLayoutConstraint * ) 0x60c0004a6240)
  .constant = 0(double) $ 29 = 0(lldb) po((NSLayoutConstraint * ) 0x60c0004a6240) <
  NSLayoutConstraint: 0x60c0004a6240 @LoginEntryViewController.swift #38 UIImageView: 0x7fb8676befd0.top = = UIView: 0x7fb867652b70.top >
Then through the output test, we know that the modification has been successful. However, the interface display is not refreshed. At this time, we need to call [CATransaction flush] function to refresh it manually.
(lldb) e -l objc-(void) [CATransaction flush]
Here the -l parameter is used to specify that the language is Objective-C, and then the refresh method is called through the Objective-C code. This allows you to view the modified effect instantly.
4. Using command aliases
You can customize the abbreviated commands of LLDB through command alias to improve the input efficiency. For example,
1 2command alias poc expression - l objc - O - command alias flush expression - l objc - (void)[CATransaction flush]
By adding these command aliases to the .lldbinit file, it will take effect every time you start LLDB.
Conclusion
Effective use of the LLDB command can improve our debugging efficiency, and also reduce the number of project compilations and runs, thereby saving a lot of development and debugging time.
References
LLDB official website: http://lldb.llvm.org/
LLDB Cheat Sheet: https://www.nesono.com/sites/default/files/lldb cheat sheet.pdf
Advanced Debugging with Xcode and LLDB. https://developer.apple.com/videos/play/wwdc2018/412/