Challenge Overview
Challenge Overview
Our customer wants to forecast oil and gas production daily for the 3 years in the future based on the historical data of existing wells. A few different curve fitting algorithms have been tried in R. Now, the client wants to move this codebase to Python and set up an evaluation pipeline to compare these fitting algorithms.
Background
Background theory regarding Decline Curve Analysis (DCA) analysis in oil and gas can be found here.
Off-the-shelf R packages, such as the aRpsDCA package found in the cran.r-project library, do not come with the necessary outlier data point filtering required to create an accurate forecast and are only good for wells in a perfect world. Attempts by the customer to develop an internal algorithm that can add filtering capabilities to the DCA method have been unsuccessful.
Task Detail
The client has made some initial attempts to fit the curves using different DCA functions in R, including hyperbolic, exponential, harmonic, and hyperbolic-to-exponential. In this challenge, we would like to turn these implementations into Python and deliver a systematic comparison. All curve fitting models must use the above-mentioned functions, with a preference towards hyperbolic-to-exponential on oil streams, and exponential on gas. The ability to add constraints to the curve fitting algorithm will be required as well, such as keeping the b-factor between 0.5 and 2.0, or the EUR (estimated ultimate recovery) between two values.
Here are the general guidelines about what you should do in this challenge.
-
Read & run the R script to understand what has been explored before. For example, there will be separate models for every well, and each well requires a model for the oil and gas declines.
-
Find similar packages for hyperbolic, exponential, harmonic, and hyperbolic-to-exponential fittings in Python or implement them by yourself. Note that it is prefered to not convert the R script line-by-line.
-
Evaluate and compare these fitting algorithms using train/test splits based on the time. Root mean square error (RMSE) is a good measure for accuracy, and can be used to evaluate effectiveness on test wells. However, please keep in mind that there could be many outliers in the test data. So the client will finally judge your fitted curves using hold-out data visually. Akaike Information Criterion (AIC) and Bayesian Information Criterion (BIC) are the two additional criteria that the client will look at.
-
Explore the effects of outlier data points and think about how to filter them out for a better accuracy. This will be key to a successful final product, and is what much of the existing code is geared towards. Moreover, it is important that the outliers are not simply removed but identified for further examination.
-
Create a report to present your findings, conclusions, and sample fits. Findings should include a recommendation on the minimum amount of data needed on a well to comfortably fit a curve, and discuss outlier filtering techniques if different than what was found in the original code.
Dataset Description
Please download the data through the Google Drive link posted in the forum. There are three csv files:
-
api.list.csv/api.list.xlsx & train_ops_results.csv/train_ops_results.xlsx.
-
These two files are the main input that you are going to use.
-
The columns “GROSS_OIL_BBLS” and “GROSS_GAS_MCF” are the two variables that we want to make forecasts.
-
Some of the wells only have partial data points until the year 2016. The remaining of them are held out for the testing purpose.
-
-
test_ops_results_blank.csv.
-
It contains the wells and dates that we masked the oil/gas outputs.
-
In your submission, you should append two more columns “GROSS_OIL_BBLS” and “GROSS_GAS_MCF”.
-
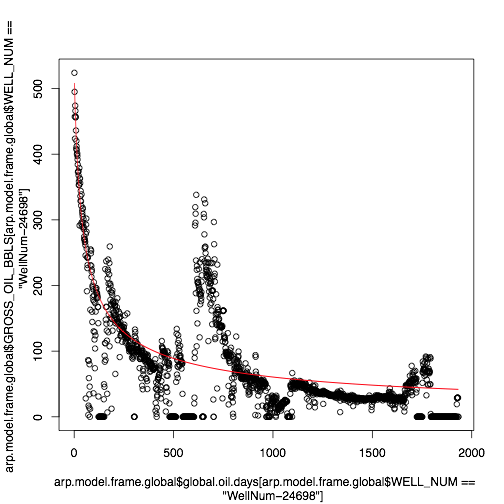
By running the provided “example.R”, you will see some warnings and/or errors, but you should be able to see some curves like the following one. Considering the outliers in the data, we will evaluate your submission visually using similar plots.
Final Submission Guidelines
Submission
Contents
We mainly require two things in the submission:
-
Python3 codes. There should be two functions, one for fitting curves and forecasting, and another for evaluation. Please try to make use of existing libraries appropriately and document the code.
-
A complete set of unit tests for the app. 80% code coverage is required.
-
A document including analysis and comparison between different fitting methods.
-
A filled test_ops_results.csv file that contains the forecasts for all the wells. They should follow their original order.
Format
-
A document should be a minimum of 2 pages in PDF / Word format to describe your ideas.
-
It should be written in English. This documentation isn’t being evaluated for English grammar and spelling, only the quality of your ideas and your technical approach.
-
Leveraging charts, diagrams, and tables to explain your ideas is encouraged from a comprehensive perspective.
Judging Criteria
You will be judged on forecast accuracy, how well the code is organized and documented, how clear the comparison is conducted. Note that, this contest will be judged subjectively by the client and Topcoder. However, the judging criteria will largely be the basis for the judgment.
Accuracy (35%)
-
Please make sure hyperbolic, exponential, harmonic, and hyperbolic-to-exponential are implemented.
-
Please demonstrate the accuracy of different methods, either in a table or a chart.
-
Please explore the effects of outlier points and how to filter them to obtain a better model.
-
The client will further look at your forecast curves on the hold-out data.
Performance (15%)
-
We will rank the solutions in order of execution time on the training set.
Comprehensiveness (30%)
-
Please try to explore as many fitting methods as possible.
-
The ones used in the R scripts are strongly recommended.
-
Unit test coverage should be at least 80%. Implementation with coverage.py or equivalent test coverage library is strongly encouraged.
Clearness (20%)
-
Please make sure your report is well-written.
-
Please make sure your code is well-documented. Use the following style guides Google Python Style Guide, Python Style Guide, and Docstring Conventions. Please make sure it is well-engineered but not over-engineered (YAGNI and KISS) solution. We're looking for well-structured and tested code. Well-structured code follows good design principles like the SOLID principles and well-tested code has comprehensive unit tests.
-
The code should be implemented using Python3 only.
Submission Guideline
Python 3.6.x
Supplementary materials
You will be able to download from the Google Drive link posted in the forum.