Challenge Overview
The client is looking to build dynamic reports out of database tables of data. Their current tool allows these reports to be built by a developer, but this requires a normal development cycle to build, test, and release these reports. They would like to have a system in place that allows them to build these custom reports, joining multiple database objects (tables, views, stored procedures) if necessary, into dynamic data to populate different visualizations.
The closest system to equate it to would be Salesforce Reporting. In there, you can wire up multiple related objects into a grouped, filtered, and sorted data source.
The goal of this challenge is to integrate “Dashboard” page with backend, and implement the missing pieces to make that page functional
Challenge Requirements
Pages in Scope
You will implement “Dashboard” page and all backend/frontend that support the functionality of this page.
Architecture
You are provided with an architecture documents, it in extensive implementation notes are provided at method documentation on UML Class Diagrams. Please follow them for implementing the required controllers if the controller is not already implemented from past challenges.
Please read the whole Application Design Specification first. All the details not mentioned in this specification are provided in that document.
Please note there may be some changes needed to backend in order to support the frontend features, these are in scope of this challenge as well.
Authentication
Authentication and authorization are out of scope for this project, the backend should expect network ID to be passed to the backend.
So in this challenge you need to enable windows authentication in IIS, and use that information to authorize the user.
Front End Classes
This code challenge is responsible for implementing all classes on class diagram "Front End Class Diagram" that will be needed to implement the frontend pages in scope of this challenge.
The REST API endpoints of the handlers are configured via web.config like below:
<httpHandlers>
<add verb="supported http verbs" path="path" type="namespace.classname, assemblyname" />
<httpHandlers>
The path is up to assemblers, it may be like <base-url>/<handler-name>.
Rendering Report Charts
You will reuse the same charts rendered in Report Details page and Preview step in Generate Report flow.
Refer to previous challenge specs “Rendering Report Charts” to understand how we implemented the charts.
https://www.topcoder.com/challenge-details/30050556/?type=develop&noncache=true
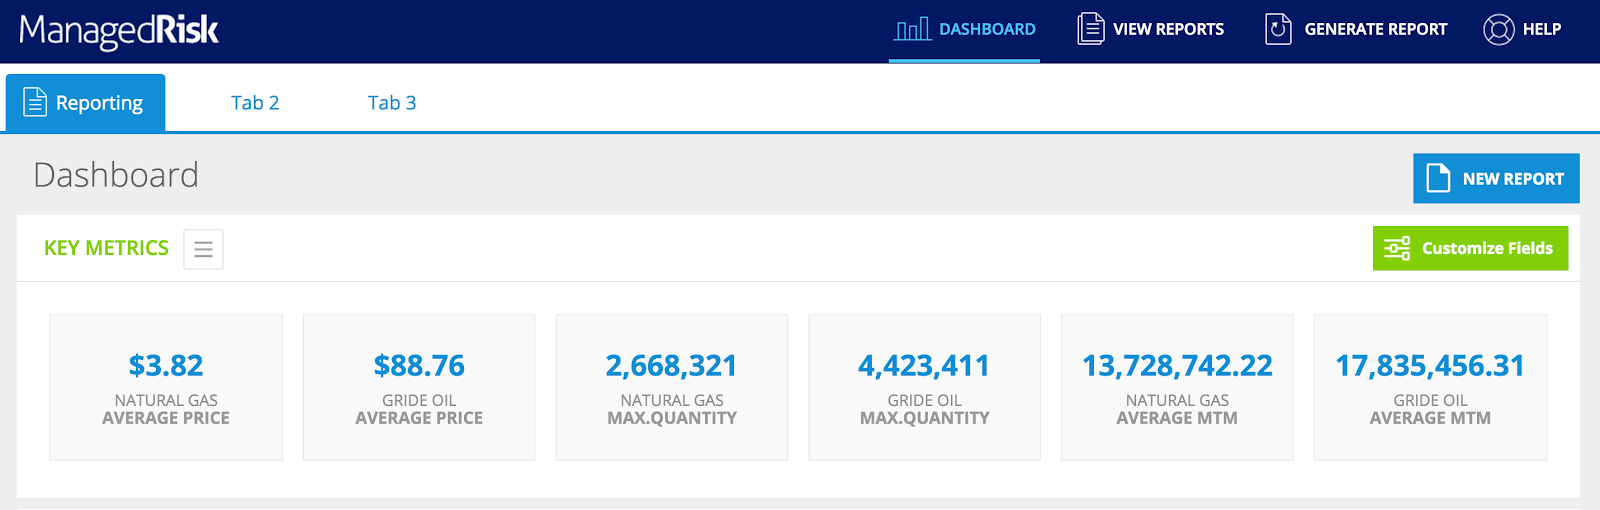
Dashboard Page
-
- Note that charts are rendered in server side, and other content is managed in client side using REST API. When the page is rendered in server side, the charts are rendered as mentioned in “Rendering Report Charts” section.
-
- When the page is rendered, retrieve report by id, if report.DisplayGraph is true, then the report graph should be shown, here is how to get charts to be added in dashboard:
-
- // get user’s dashboard reports
-
- Get reportService:IReportService from Unity;
-
- string user = HttpContext.Current.User.Identity.Name;
-
- IList<long> reportIds = reportService.GetUserDashboardReports(user);
-
- IList<Report> reports = reportService.Get(reportIds);
-
- For each report of reports
-
- if report.DisplayGraph is true, then render it according to “Rendering Report Charts” section.
-
- if report.DisplayReportData is true, then show a table of the report, it calls SearchReportDataHandler to search data of a report.
-
-
-
- When customizing key metrics, it calls GetUserKeyMetricsHandler to get user key metrics, calls SaveUserKeyMetricsHandler to save user key metrics, and calls GetUserKeyMetricsValuesHandler to get user key metrics values.
-
- For the Custom Reports section:
-
- Table Pagination and Sorting should be implemented server side.
-
- It calls the SearchReportsHandler to search reports.
-
- Clicking a report forwards user to the Custom Report Detail page.
-
- The edit icon forwards user to the Custom Report Detail page.
-
- The copy icon forwards user to the Generate Custom Reports page, with the selected report populated into the page. The copy is not done in server side yet, only after user modifies and saves the copied report, a new copied report will be created.
-
- It calls DeleteReportHandler to delete selected report.
-
- The “share report” will trigger ShareReportHandler.
-
- For report export, it calls ExportReportHandler to do so.
-
-
- The operations of the sections (Key Metrics, My Reports, Price Index Report Table) should be removed, the section titles are simply static labels. We should not have operations against the sections. We only manage section elements.
-
- Assuming there are report A, B, C, D in the dashboard reports: A shows graph, B shows data, C shows graph, D shows data. Then the My Reports section shows graph of A and C; the below section shows tables of B and D.
Report Details Page
Implement “Add to Dashboard” button, it will use AddUserDashboardReportHandler to add report to dashboard.
Technology overview
- Windows Server
- SQL Server 2012
- Visual Studio 2012
- IIS 7
- C#
- .NET Framework 4.5
- ASP.NET
- Unity 3.5 http://unity.codeplex.com/
- Enterprise Library 6 Logging https://msdn.microsoft.com/en-us/library/ff648951.aspx
- Quartz.NET 2.3.3 http://quartznet.sourceforge.net/
- jQuery 1.11.3 http://jquery.com
- Microsoft OpenXML SDK 2.5 https://msdn.microsoft.com/en-us/library/office/bb448854.aspx
- DevExpress ASP.NET Chart Control http://demos.devexpress.com/XtraChartsDemos/Default.aspx
Existing Documents
- Class Diagrams
- Sequence Diagrams
- Application Design Specification
- ERD
- Source Code that you will use as basis for your work.
GitLab Access
-
- You can get access to the Gitlab repo group in this tool http://tc-ragnar.herokuapp.com/ragnar/groups/5613f730d601610e000f21bd/290828 . If you are having trouble with the auto registration tool, please ask in the forums.
-
- Once added to the team, fork the repository and work off this branch https://gitlab.com/aers-managed-risk/backend/tree/30051803-dashboard-page-frontend
Final Submission Guidelines
Submission
-
- Upload documentation for how to run your submission
-
- Upload all your solution as git patch files.
-
- Add elkhawajah as a member of your forked repository
-
- Winner will be required to submit a merge request on gitlab against the branch specified.