Challenge Overview
The goal of this challenge is to build a simple PVWatts calculator in bootstrap/angularjs/nodejs.
Challenge Requirement
You are building a single nodejs page with following requirements :
-
- Use ExpressJs/AngularJS/Bootstrap default theme to implement requirements.
-
- Add a form for the user to input their full address and a button they can press on to "Submit".
-
- The address value is similar to the address used in google geolocation service that converts the address to lat/lon.
-
- After pressing this submit button the user will see a validation error if the input is not a valid address.
-
- Use google geocode api service for auto complete and validating the address.
-
-
- Using the retrieved lat/lon in previous step use this PVWatts API to retrieve the climate data. We are only interested in the first weather data from the returned list from the API.
-
- Render a Google map below the address form with a pin/marker of the user address dropped in the map.
-
- It should be in “Satellite” imagery mode so user can see her building roof.
-
- Add a button("Calculate Usage") below the map.
-
- Scroll the page so that the map is centered and “Calculate Usage” button is visible to user.
-
-
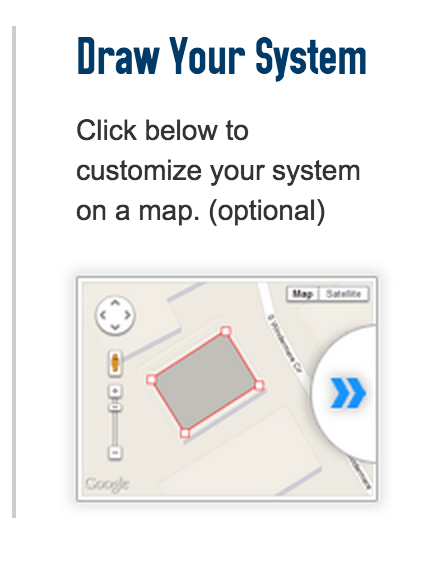
- Add a custom layer in top of the google map to show user how “Draw Your System”.
-
- Refer to this page. It is a built-in PVWatts calculator, insert a US zip code for a residential address, then click on “System Info” tab. You will see a screenshot like this one.
-
- Click on the google map thumbnail in above screenshot will open up a google map with a custom layer showing how to “Draw a System”. What you are going to do is to show similar custom layer in the google map we are rendering in the homepage to tell user how to draw their system.
-
- Add option to user to set this pop out not to appear again by checking a "Got it! Not show this message again" checkbox.
-
- To understand how to draw a polygon and calculate system capacity you can refer to measureAdd and measureCalc in maps.js file in pvwatts calculator page http://pvwatts.nrel.gov/pvwatts.php
-
-
-
- Add ability for Users then will draw their system, same as done in PVWatts draw my system page referenced above.
-
- Users can press on "Calculate Usage" to get detailed results as to how much the system will generate and cost each month at the bottom of the page.
-
- This API will be used to calculate usage.
-
- We are replicating how user can see the results in “Results” tab in this page http://pvwatts.nrel.gov/pvwatts.php .
-
- The variable API request parameters we will pass to this api :
-
- address (entered by user)
-
- the first climate data id, will be passed in file_id.
-
- system capacity calculated from drawn system in the map.
-
- To calculate this value you can refer to the JS function (measureCalc) in http://pvwatts.nrel.gov/pvwatts.php
-
-
-
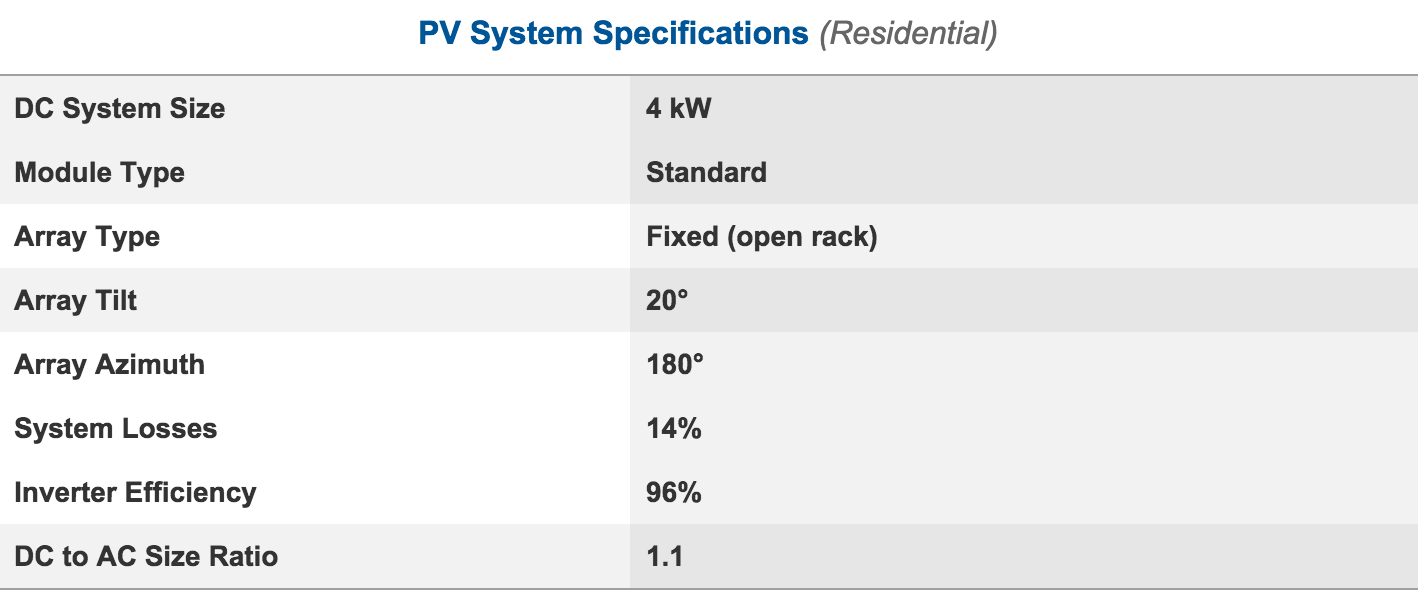
- For this functionality, we will store the default values of the API request parameters to be used in the calculation in configurations. The request parameters we will configured are :
-
- api_key
-
- system_capacity
-
- module_type
-
- losses
-
- array_type
-
- tilt
-
- azimuth
-
- timeframe
-
- dc_ac_ratio
-
- gcr
-
- inv_eff
-
-
- Other fields needed by the API not listed above are not needed.
-
- For the configured request parameters default values you can use the values set under System Info tab in PVWatts calculator page http://pvwatts.nrel.gov/pvwatts.php
-
-
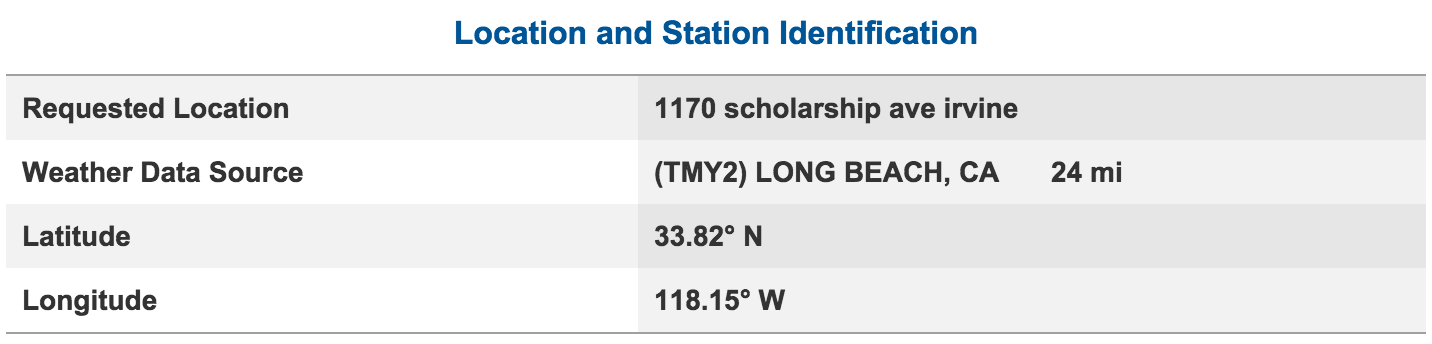
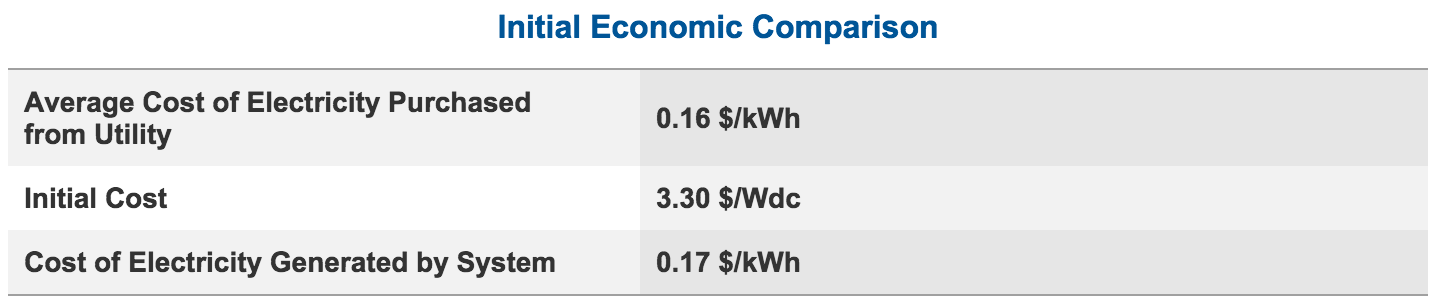
- Render the response of the API below the google maps with same structure as in “Results” tab in PVWatts calculator page.
-
- The structure should match the pvwatts results structure :
-
- yearly result
-
- monthly result
-
- Display the Warning icon and Cautions message in top of location info as it is currently displayed in the PVWatt page.
-
- location info
-
- PV system spec
-
- Initial economic comparison
-
-
- Add a button “Reset” to clear/hide the calculation result output and take user to address form (add focus on the address field).
-
-
- All sensitive information should be configurable.
-
- Don’t expose any API keys in the frontend JS side.
-
-
- Calling PVWatts api should be from nodejs side.
-
- Create a README file to configure, setup and deploy the app.
-
- Your API backend design should expose endpoints where each endpoint is self-contained functionality.
-
- Your code should properly use logging, validation, and error handling.
-
- Use watson for logging, use INFO for method entry/exit, DEBUG for parameters/response, and ERROR for errors.
-


Technology Overview
-
- Node.JS/Express.JS
-
- AngularJS
-
- Bootstrap
-
- Google Maps API
-
- PVWatts API
Final Submission Guidelines
Deliverables
-
- The files that addressed the above solution.
-
- Detailed deployment guide for how to setup and verify your solution.