Challenge Overview
Problem
The world’s forests, fisheries and wildlife are subject to many pressures, but illegal activities are especially damaging due to their scale and scope. Illegal fishing poses a serious threat to marine ecosystems, the sustainability of fisheries, coastal communities that depend on fisheries resources, global food security, and has ties to piracy and threatens maritime security. It is estimated that IUU fish comprise 31% of the global seafood catch. IUU fishing also hurts economies all around the world by reducing tax and government revenue, increasing costs for monitoring fisheries and depleting stocks available for legitimate fishermen. WWF and TRAFFIC have developed a methodology to identify products in international trade that are suspected of having been illegally sourced, by comparing Customs import and export data. For example: if Russia reports significantly less exports of king crab to South Korea than South Korea reports in imports of king crab from Russia, this suggests there may be some illegal trade occurring in king crab between the two countries. While the methodology for the comparative analysis exists, it is rarely used as it is relatively time-consuming to apply manually.
This challenge is part of the HPE Living Progress Challenge Blitz Program (Secure top placements in the leaderboard to grab additional cash prizes)
Trade Data Comparison Use Cases
In this challenge, we’re going to build the foundational audit process to identify two basic scenarios using the Trade Data compiled by the UN that originates from country submissions that might indicate that illegal trade is going on. (It should be noted that these flags only indicate possible wrongdoing. There will be false positives, but we’re hoping to provide customs officials, fisheries authorities and investigators and other interested parties direction for avenues for further analysis.)
1. Comparing imports and exports between trading partners. The application should examine the imports received for each reporting Country and compare those with the exports reported by the Partner. In order to do this you basically need to compare the results of two queries. Let’s looks at a specific example. Let’s say you want to compare imports in Trout (Commodity Code: 30211) reported by the US from the UK with exports of trout reported by the UK to the US. You would run the following queries on our database to compare them:
Imports to the US
select classification, year, tradeFlow, reporter, partner, commodity, netWeightKg, tradeValueUSD from Record where reporter = 842 and partner = 826 and tradeFlow = 1 and commodity = 30211
Exports from the UK
select classification, year, tradeFlow, reporter, partner, commodity, netWeightKg, tradeValueUSD from Record where reporter = 826 and partner = 842 and tradeFlow = 2 and commodity = 30211
The idea is to generate a table of data basically like so:

What we’re really looking for here are instances where the the imports reported are greater than the exports reported like for line 12 shown above. Note that the focus should be on comparing weight, rather than value. Value comparisons can also be useful but even where the weight match, the value are almost certain to differ as values on the export side are ‘free on board’ whereas those on the import side almost always include insurance and freight, and are accordingly higher. Now for Trout -- because this is often “farm-raised” this isn’t such a concern but for fish like Tuna or Swordfish this is more serious. Another issue we’ll need to deal with is missing data. Let’s not report issues for years where the data for one of the trading partners in missing. Also we should highlight differences in weight (netWeightKg column) rather than using the tradeValue columns, as those value changes may reflect market fluctuations, not illegal activity. The system should add a record to the trading flow alert list (#1 below) where the import netWeightKg is 50% or more greater than the reported export weight during the same year and where the source field = ‘Wild caught’. Obviously this assumes that the weight figures are available for both the reporting country and the partner. Please make the level (the 50% value) configurable.
2. We want to identify instances where changes in import or export volume for a particular commodity change by 200% or more. Please make the volume percentage change value configurable.
Functional Requirements
1. Trading Flow Alert List: The app should include a listing of possible trading flows which have either of the two highlighted issues. Users should be able to filter the possible trading flows by reporting country, partner country, commodity, and % difference in weight, netWeightKg, and tradeValue. Please allow users the ability to combine filters.2. Trading Flow Detail Screen: Click on a trading flow should bring up a table of data similar to the one listed above. Rows which indicate one of the issues identified above should be highlighted.
3. Trading Flow Detail Screen: The trading flow detail screen should include a graph which shows the difference in netWeightKg between Import and Exports. Showing the differences over all the available years for a certain commodity is very helpful. This is a good example:

4. Admin Screen: You’ll need to provide a screen which provides configuration info for the Vertica database and initiates batch processing to identify records/trading flows where there might be an alert. You don’t need to download/query for the entire TradeData database to enable the functionality listed above. Please provide the ability for your tool to process a subset of the records/trade flows in the Record table in addition to processing all the records.
System Requirements
1. The raw trading data provided by the UN is available here for analysis:Host: 54.149.189.221
Port: 5433
Database Name: TradeData
Username: user1
Password: pass1
2. Vertica ODBC drivers are available here: https://my.vertica.com/download/vertica/client-drivers/
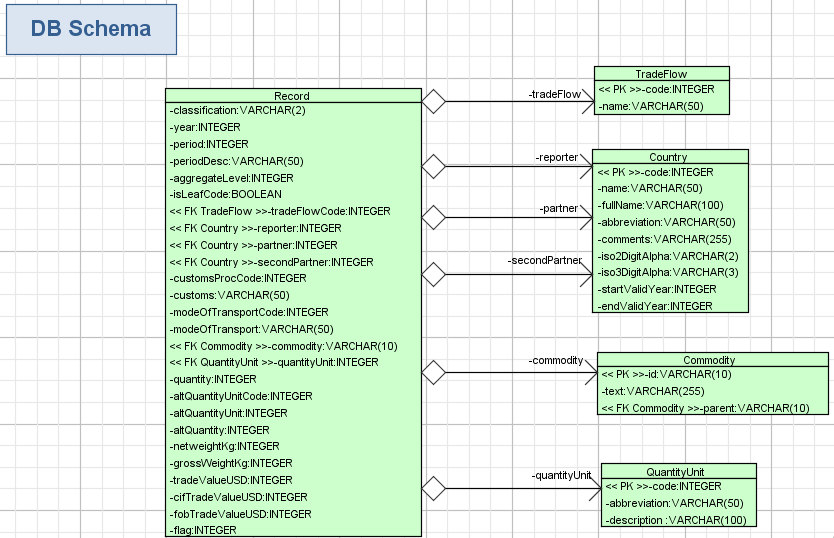
3. There are tables in database for commodities, countries (reporters and partners), and trade flows.
4. You’ll need to write your alert records a local database. You may use MySQL, PostgreSQL, or the developer version of Microsoft SQL Server.
5. You should implement your “Audit” web application upon the Microsoft .NET stack: C#, ASP.NET .NET 4.5.1+
Final Submission Guidelines
Submission Deliverables
- Full code that covers all requirements
- A complete and detailed deployment document explaining how to deploy the application including configuration information.
Final Submission
For each member, the final submission should be uploaded via the challenge detail page on topcoder.com.