Challenge Overview
Please note that although this is an Architecture challenge, it is being launched as a Code track challenge for a couple of reasons A) The end deliverables are different than a standard architecture challenge B) To encourage participation among Salesforce developers & architects within the community.
Overview:
Welcome to the Engage Together® - Architecture challenge, brought to you by Deloitte Pixel™! The objective of this challenge is to propose the underlying architecture for a survey tool based on provided test data and given considerations:
- The client is a non-profit organization helping to fight human trafficking
- During meetings around the country the non-profit team is capturing how different organizations around the region are helping to fight human trafficking. This is currently done in a manual fashion, and later entered into Salesforce. The team is currently working on a mobile friendly survey tool to take away some of the manual work where the data will feed directly into Salesforce. However, the current Salesforce data model and architecture does not have any powerful reporting/dashboard/visualization solution implemented, and the current data model does not support the type of visual report the team wants to generate.
We want your help in designing an architecture with Salesforce as the backbone, that will allow the team to store and do analysis on multi dimensional geographic data. Best of luck on this challenge!
======================================================================================
Full Description & Project Guide
Challenge Description:
- The architecture needs to suggest how to leverage Salesforce as a backend while possibly highlighting any dashboard/visualization tools that the team can use to generate multi dimensional geographic data (keeping in mind nonprofit specific offerings) that will be collected from a hybrid mobile app that will be used for collecting survey information.
Current state:
- The data in salesforce will be used in a few different ways:
---- Vet out organizations that should or should not be part of the partner network
---- It is used to further investigate how different organizations are helping their communities and to find where there are gaps and opportunities to collaborate (this is done based on the programmatic scope, demographic scope, and geographic scope data that is collect in a survey in the mobile app)
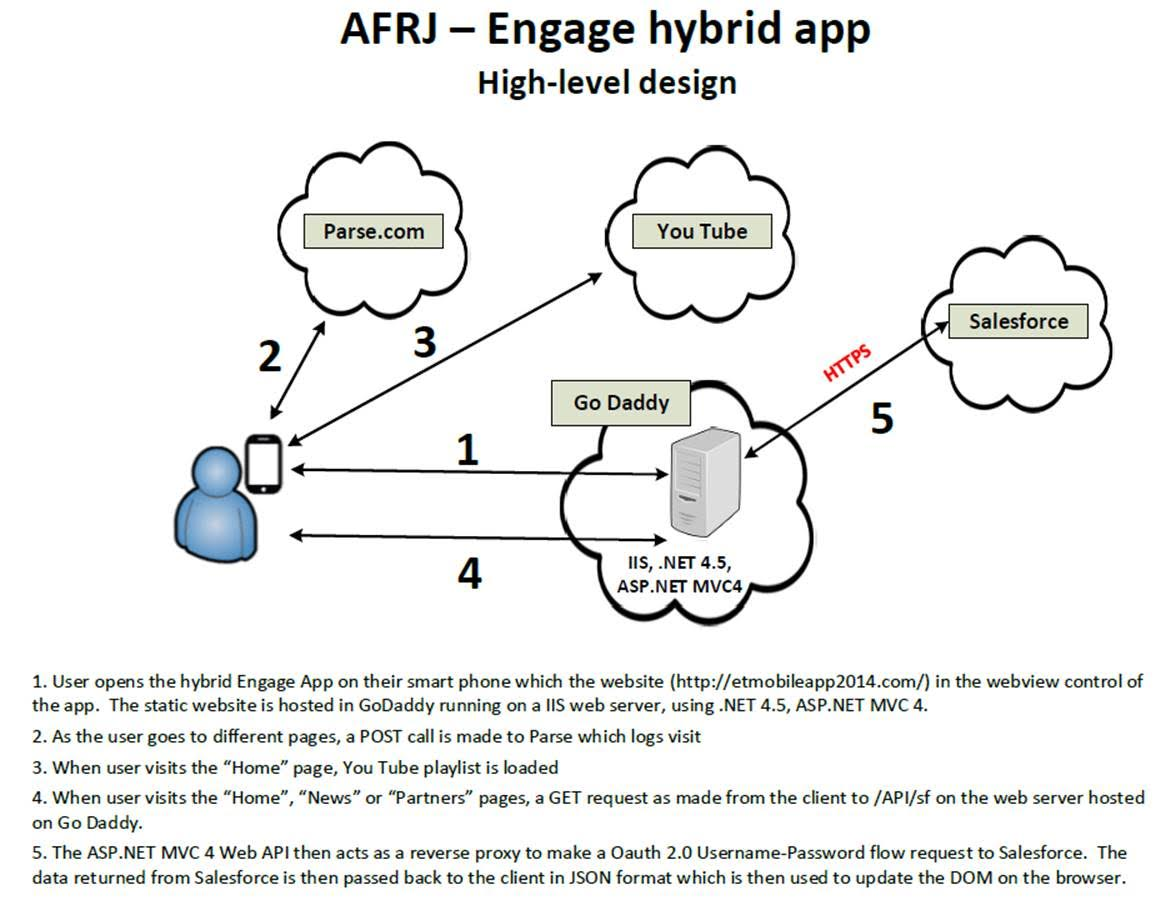
- The hybrid mobile app’s current architecture / flow is as follows
Future vision:
-- A salesforce data model that will support collecting all the data needed to do in depth gap analysis on the organization around the country (Please see attached example of visualization we would like to be able to produce)
---- A data model and salesforce workflow that will allow the caseworker to do analysis on the data collected in a two part survey as well as other collected in depth / useful data during interviews with organizations leads.
-- A integrated (or stand alond with ETL connections) reporting and data visualization tool that will allow the team to:
---- Provide local communities with a report on how they can do better (based on the findings above) - using multi dimensional geographic visual to create a wow effect.
--- Provide a more aggregated report to state level leadership on what is happening in their state. - using same visualization techniques as above but on a more high level.
-- Find a subsitute for Parse.com as the “Mobile Backend as a Service” since this service is expiring.
-- Recommend how to integrate the current CRM data into the new format.
The nonprofit already have 1000s of organizations stored in the current data model in SFDC. However, as explained some of the key geographical data and its programmatic scope are not linked in the same way as we explain in the future vision. This means that not only do we need you to propose an new structure and data model based on the new requirements above, but we also need you to come up with a smart way to ETL & integrate what is currently in the system into the new one.
---- How would you ETL all the data which has been captured in the old SFCD data model to the new one.
---- For the data that has not yet been collected on these organization how should we fill in the gap? In other words, how would you deal with the data that are missing from these records? We believe some it, if not most of the new data points could be collected/re-mapped in the 2nd part of the survey. However, we are looking for you to outline an approach of how to do this and how it would look like in salesforce.
The data that is collected:
Going forward, a lot of the data that will populate salesforce will come directly from a survey tool. This survey app will be a 2-step survey. Where the first step collects basic organization information, point of contact, programmatic scope (What they do), demographic scope (Whom they serve), geographic scope (Where they serve) and the 2nd part will ask vetted partners to provide more granular details around the programs they provide and where (what geographic area) for each program.
Basic Organization Details:
-- Organization Name.
-- Organization Type. (Drop Down List)
-- Website.
Primary Point of Contact Details:
-- Salutation. (Drop Down List)
-- Last Name.
-- First Name.
-- Title.
-- E-Mail.
-- Telephone.
Programmatic Scope:
Programmatic scope refers to the type of services an organization provides (this could include 1 or more of the following programmatic categories / sub-categories):
-- Prevention:
---- Awareness.
---- Demand.
---- Vulnerability.
-- Identification:
---- Training.
---- Outreach.
-- Rescue:
---- Intervention.
---- Temporary Shelter.
---- Services.
---- Victim Advocates.
-- Restoration:
---- Aftercare.
---- Reintegration.
-- Reforms:
---- Legal.
---- Policy.
---- Systems.
Demographic Scope:
Demographic Scope refers to the demography of the people the organization serves (this could include 1 or more of the following demographic categories):
-- Age
---- Adults
---- Children
---- Youth
-- Citizenship
---- Citizens
---- Foreign Nationals
-- Sex
---- Male
---- Female
Geographic Scope:
An organization may provide services in 1 or more geographic areas. They may serve an entire state, or only specific counties within a state. The end goal of this survey is to identify the coverage area for the organization (it will eventually be mapped and compared to coverage areas of similar organizations).
-- Country:
---- State 1:
-------- County 1
---------- City 1 (optional)
- There should also be the option to add additional geographic areas of coverage (i.e. State 2, State 3, etc).
- NOTE: We are looking for your creative ideas and suggestions to store and map geographic coverage areas intuitive and easy for the users to filter and search as well as visualize the output (more examples around this is provided below.
Other organisation related information stored in salesforce (not collected in survey):
Please see attached Salesforce data model
Current Salesforce Data Model
The current data model consists of a bunch of standard objects + some custom objects including
Custom Objects
Article__c.object
Partner__c.object
Partnership_Application__c.object
VIA_Application__c.object
Geo_Concentration__c.object
book__c.object
Current usage of Parse
The Parse framework is currently used for
User authentication and management
Logging visits
Push notification (currently not supported but will be included in future)
Intake process & tool:
1st survey - The initial survey will capture the most important information needed on the organizations and groups attending.
-- Provide program A, B, C
-- Provide these services in Area A & B
-- For Demographic A & C
2nd Survey will ask the organisation to mapp each of the program to each of the geographic area they cover.
-- For Area A, we do program A, B, C for demographic A & C
-- For Area B, we do program A, for Demographic C
-- For Area B, we do program C, for Demographic A
This survey will also focus on collecting more in-depth information such as more in-depth information around how they specifically serv. This last part is likely to come in the form of free text (unstructured data) since there is so many variations at this point that using multiselect options is simply too cumbersome.
-- age of the children supported
-- specific nationalities served
-- program specific information
Used cases:
-- Use Case One:
Organization 1 is a larger non-profit, they provide services in State A and B.
In State A they only serve county 1, 2, and 5
For county 1 and 2 they provide services X, Y only for Female adults
For County 5 they provide services X but for both Male and Female
In State B they serve all counties
For all counties in state B they provide service X for all demographics
-- Use Case Two:
Organization 2 is a small local church, they provide services in county 1 and 2 in state C
In county 1 and 2 they serve X, Y, C for all demographic
-- Use Case three:
Organization 3 is a group of high schools, they provide services in county 1 and 2 in state C
In county 1 they provide service X and Y and only for Female Children
In county 2 they provide service X but for men and Female (of all ages)
In county 2 they also provide service Y but only for adult Female
After the second survey the data could look something like this:

Reporting needs and requirements:
With the data captured in the survey we want to be able to generate a “wow” moment report/data visualisation/, dashboard showing at a county/state or region level what is happening, what is being done and what is not being done.

For example:
-- State A have x organisations supporting A, B, C effort for male and female
-- State A have no organisations supporting C effort for foreign nationality in county 1,2,3
-- In county 1, over X organisations are support A & B but no one is supporting efforts in C
This can then be distributed directly to the orgs that are filling out the survey, as a first step to action. But more important also shared with state level leadership.
Once these Organizations have been further vetted (the team has a process for this that happen in the background) the link to the second survey will be sent out to capture mission critical data on what is happening on very detailed level.
For example:
Organisation X is support A & B in county A and city of B, and for program A they are focused on a,b,c but not e and f
(although pragmatics scope categories and subcategories are well defined we want to allow organisation to provide further details on each one of them)
All this data is very sensitive when aggregated. (for example, If it gets in the wrong hands it can tell traffickers where there is no support and where they should set up shop etc.) this data will be used to do further analysis (perhaps via another interactive dashboard) and shared with state level leadership for more larger scale efforts as well with neighboring organisations to highlight collaboration efforts and opportunities for improvements.
Objectives
The updated architecture must meet the following requirements:
-- Suggest a replacement framework for Parse.com as it’s been discontinued
-- Use the provided survey data fields and custom objects and online how it must be persisted in Salesforce
---- how would you structure the data collected to make report and management of the data easier and so that the team can visualize the data as explained earlier in the requirements? The team might be interested in a data warehouse in the future, however how can you organize the data today to allow for advanced reporting directly in salesforce today?
---- Data model needs to be implementable in salesforce
-- How to create and run reports (again, while leveraging Salesforce capabilities) will drill down capabilities based on chosen data model
-- Suggested data visualization tool strategy
----- build custom inside salesforce (custom or wave) or outside tools like Tableau or Qlikview etc. , if outside tools how would they be integrated into salesforce (ETL, DW etc.)
----- Keep in mind that this is an non-profit with limited IT Staff and IT budget so opensource, simple or cheaper solutions are prefered
----- Keep in mind that the reporting solutions needs to not only produce regular CRM reports but also multi dimensional geographic heart maps (please see attached examples)Provided Artefacts
----- Existing mobile app code (Gitlab link in forums)
----- Existing data model dump (availalbe in forums)
Final Submission Guidelines
You must provide the following:
-- Updated data model in Salesforce
-- Reporting / Data Visualization Strategy and Structure
-- Replacement for Parse.com for hybrid app with due justification
-- Strategy & approach to migrate data from the current data model to the new one