Challenge Overview
In this challenge, we need to create a set of functionalities using (ideally) Google Maps. Those will be used in a ReactJS dashboard application but for this challenge, you can use either ReactJS or Javascript.
If for some reason, any of the requirements are impossible to implement using Google Maps, feel free to suggest another library in the challenge forum.
Detailed Requirements
1. Custom markers
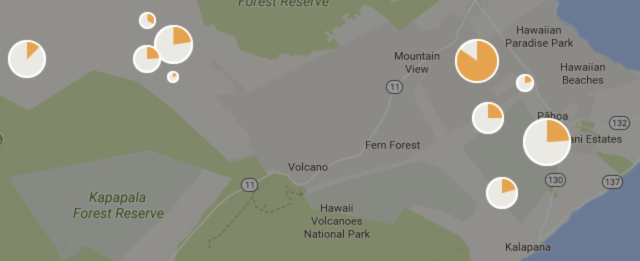
Create custom pie chart markers.
-
Each pie chart (marker) will have 3 slices, not 2 as shown in the image above.
-
Each slice will have a pre-configured color.
-
The pie chart (marker) size will be calculated as FIXED_SIZE * markers[index].size where FIXED_SIZE is a configurable variable, markers is an array of object that contains the marker data and markers[index].size is a value between 0 and 1.
-
Each object in the markers array will have the following format:
{
lat: 0, // Latitude
lng: 0, // Longitude
a: 0, // 1st slice of the pie
b: 0, // 2nd slice of the pie
c: 0, // 3rd slice of the pie
size: 0 // used to determine the marker size
}Where a, b & c are the values for each slice of the pie and their sum is equal to 100.
-
Add 2px white border to the pie charts like in the above image.
-
Clicking each marker should print its index in the console log.
IMPORTANT! The final app will render MANY markers. You need to make sure the performance is good. The final app will use marker clusters. It’ll be great if you can use marker clusters and render many markers to show that the performance is good.
2. Create Polygons

You need to render a set of polygons (3-4 for demo purposes).
-
Each polygon should have a different color. Not a random color, use an array of colors for this. Also, the colors need to have some transparency (eg 45%).
-
Each polygon must have a hovered state (white border).
-
Clicking a polygon must print its index in the console log.
3. Lasso tool

Create a lasso tool that will allow the user to select an area in the map.
-
Releasing the mouse, should close the selection and print the selection details (array of selected coordinates) in the console log.
-
Match the styles from the above image.
Note: The selected coordinates are the coordinates from the perimeter.
Final Submission Guidelines
Submit the source code in a zip file and a deployment document.
A video (unlisted on YouTube) showing your implementation in action is also desired but not required.