Challenge Overview
Prize Distribution
1st Place - $1800
2nd Place - $1200
3rd Place - $600
Challenge Overview
Given an image of a thin section from a core sample, we already have a tool that can detect the area of the rock depicted in slice and identify the edges/shapes of the individual grains making up the slice. In this challenge, you are going to do one step further to calculate the grain size.
Background
The state-of-the-art of thin section analysis requires a significant amount of expert effort. Currently, the geologists examine photos and identify the grain size, shape and the mineral content to understand the characteristics of the sampled geology. These attributes are evaluated to determine the porosity of rock and other characteristics which are important to hydrocarbon extraction.
Task Detail
In this challenge, we are focusing on the grain size calculation.
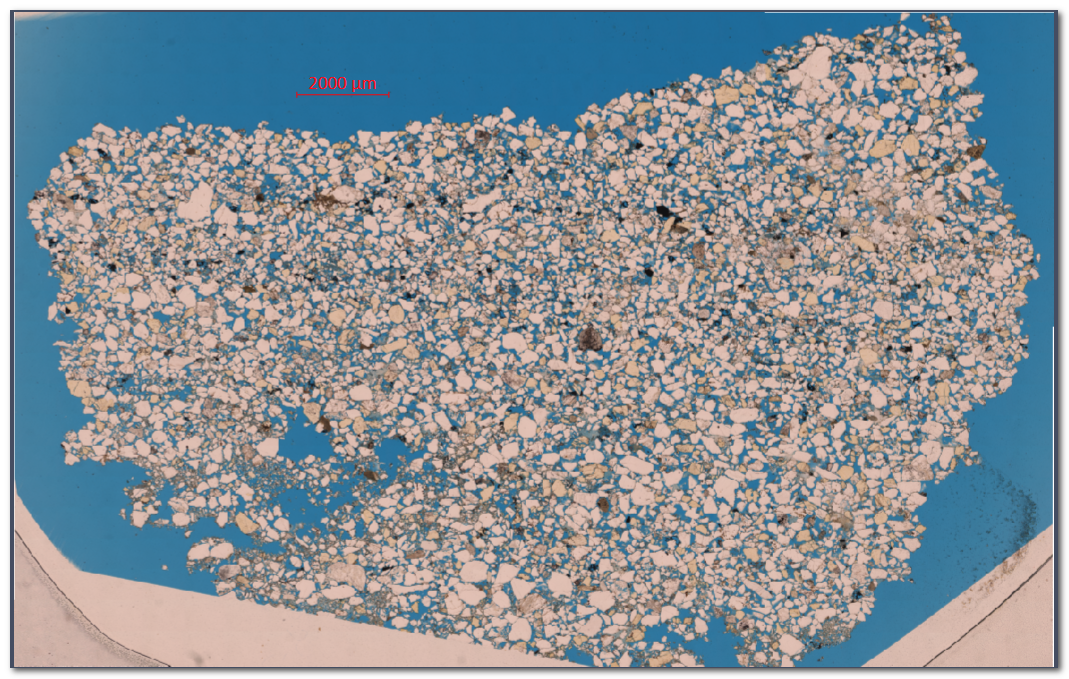
The input of this task is a sample thin section image. A possible input is as the following.
We have run a challenge about the grain detection, which can extract different areas of grains from the input image. We provide the winner’s solution here, and now you need to take its output and further calculate the grain size statistics. In this challenge, you’ll be adding the ability to calculate the following grain size statistics to the existing code base.
Your output should contain the grain size statistics in the following order:
-
Median
-
Mode
-
Mean
-
Standard Deviation (i.e., Sorting)
-
Skewness (both mathematical and graphical)
-
Kurtosis
-
Porosity. It is defined as the percentage of the open space relative to the area enclosed by the outer boundary. Here, “open” means it’s not enclosed in any grain.
Each statistic corresponds to a line in the reporting output of the application. For Sorting, Skewness, and Kurtosis, please also put the corresponding tags based on the tables on pages 4 and 5. Please validate the accuracy of your calculations and ask questions in the forums in necessary.
In our two sample slides, 2000 micrometers are equal to 1389 pixels. That is, each pixel is about 1.439885 micrometers. Please make the scaling measurement a parameter that can be easily altered for later usage. In future, we might be processing images at different resolutions.
Data
Please find the post in the forum for all raw images, previous winning solution, and the PDF document.Final Submission Guidelines
Submission
The submission package should include the following items.
-
A document which outlines your implementations of the various formulas, this will be helpful our subject matter experts
-
Your source code
-
A Readme.md file which outlines a step-by-step instruction about how to run your code and any dependencies it contains.
-
Please build your solution using the existing codebase and build files as a starting point.
Submission Guideline
We will only count your last submission as your final submission. We encourage you to include your solution and the written explanation in a single submission.
Appendix - Grain Detection Spec
These are the specifications for the previous challenge which are being provided for reference purposes. They've already been implemented in the code currently provided.
-
The outer boundary of the slice (i.e., a polygon enclosing the slice) and its overall area. This is a fundamental step towards the success. The following image presents an example of the outer boundary using the black line. This image will be included in the provided dataset as well.

-
A single core slice contains thousands of individual mineral grains. You are being asked to identify the region of each individual grain against some kind of background. The image below shows an example of some regions of individual grains (e.g., the blue lines). Note that, it is NOT required to identify the specific mineral type for each region. We’ll need to identify a polygon for each individual region/grain as well as the region boundary area and summation of grain volumes.

-
The application should produce a csv report which contains the coordinates for the bounding shapes requested in #1 and #2 above.
-
The last record for each shape in the report should report the shapes area.
-
For the i-th region, the format is as the following
-
x_{i, 1}, y_{i, 1}, x_{i, 2}, y_{i, 2}, … , x_{i, n_i}, y_{i, n_i}, area_{i}
-
i is the row index of the csv report. n_i is the number of points in the i-th region’s boundary polygon. The first n_i pairs of floating numbers are the coordinates in the counterclockwise order. The last floating number is the area of this polygon.
-
-
In addition to the csv report, please generate the visualizations as well.
-
An image which plots the polygon for the overall slice.
-
An image which plot the polygons/boundaries for each individual grain. Each individual grain should be highlighted and annotated with its unique ID (e.g., the row index in the csv report) as well as its information.
-