Challenge Overview
Challenge Objective
The objective of this challenge is to generate time-series forecasts with the highest accuracy predictions possible for the financial variables outlined below.
The accuracy of the forecast must at least improve on the Threshold targets quoted for each variable - targets based on the models sourced from an alternative challenge.
The model should be tailored to a 12-mth forecast horizon but must be extendable beyond this time period.
The accuracy of a prediction will be evaluated using MAPE (Mean Absolute Percentage Error) on the privatised data set over a period of 6 months and on the maximum Absolute Percentage Error on any one month over this same period.
Introduction
A Mobile network, to be known as Sandesh, is looking to create a high quality, high accuracy time-series forecast for a number of key Financial metrics.
The target variables are financial metrics
-
Revenue - the revenue generated by the subscriber base per month for the ‘airtime and data’ service for all products within Sandesh Brand 1. Revenue is therefore the aggregate of all three products - Leopard, Panther and Lion and should be predicted as a single variable..
-
Leavers - the number of subscribers per individual product who terminated service with the brand during that month.
-
Gross adds - the number of new subscribers to each individual product joining the brand during a month.
-
Net Migrations - the net number of subscribers moving onto the individual product per month from an alternative product within Sandesh Brand 1. Net Migrations for all three products should add up to Zero (or very close to Zero).
-
Closing Base - the number of subscribers to an individual product at the end of each month. This change in Closing Base from one month to the next is therefore the sum of Gross Adds and Net Migrations, minus Leavers.
Business Insight
Financial Year modeling:
Sandesh reports its financial year from April - March. This may contribute to seasonality based on financial year, and quarters (Jun, Sep, Dec, and Mar), rather than calendar year.
Anonymised and Privatised data set:
‘Z-score’ is used to privatise the real data.
For all the variables, following is the formula used to privatise the data:
zi = (xi – μ) / σ
where zi = z-score of the ith value for the given variable
xi = actual value
μ = mean of the given variable
σ = standard deviation for the given variable
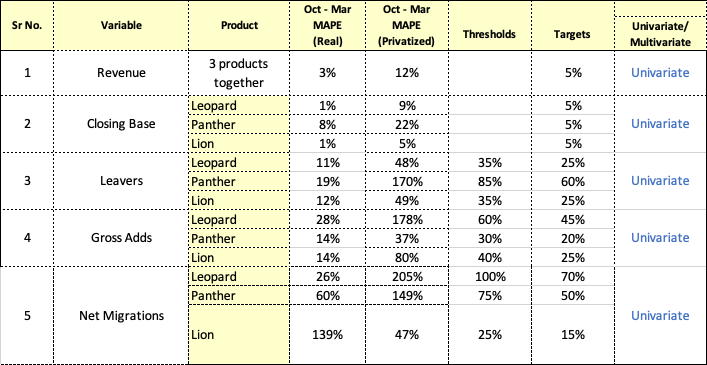
Targets and Thresholds
The performance of the models on privatised data is not directly correlated with performance on Real Data. These Thresholds and Targets have been generated using the foundation models described below.
Your submission will be judged on two criteria.
-
Minimizing error (MAPE).
-
Achieving the Thresholds and Targets designated in the tables above.
It is recommended to optimise the models to minimise RMSE, as opposed to MAPE. The privatisation method used (see section earlier) can distort the error analysis.
The full evaluation criteria will be outlined in the Quantitative Scoring section below.
Modeling Insight
Revenue and closing base:
LSTM Model was used. Stacked lstm with time distributed layer has been used.
We have seen that while framing the data for LSTM the best input shape was (12,1). 12 is our look back period and 1 period has been forecasted.
Size of the first hidden layer = 50, second hidden layer size=50, batch size=5,activation function used were tanh and relu.
model = Sequential()
model.add(LSTM(num_hidden_1, activation=activation_1, return_sequences=True, input_shape=(timesteps, num_features)))
model.add(LSTM(num_hidden_2, activation=activation_2, ))
model.add(RepeatVector(num_outputs))
model.add(TimeDistributed(Dense(1, activation="linear")))
model.compile(optimizer='adam', loss='mse', metrics=['mse'])
Leavers:
Sarimax with pdq=(1,1,1) and PDQm=(1,0,0,12)
Gross Adds:
SARIMAX Model with pdq=(1,1,1) and PDQm=(1,1,0,12) has been used to get the best output.
Net Migration:
LSTM. 3 layers stacked lstm with drop out layer. LSTM Unit size=30. loss function:'mean squared error', optimizer: adam.
for data preparation of the lstm model, we took 1 look back to predict one step at a time.
Final Submission Guidelines
Submission Format
You submission must include the following items
-
The filled test data. We will evaluate the results quantitatively (See below)
-
Please use Time Period, Generic Keys as the column names.
-
The values in Time Period column are something like 2019-08
-
The values in each Generic Key column is the predicted values, i.e., floating numbers.
-
The final spreadsheet has a Nx(M+1) shape, where N is the number of time periods and M is the number of variables that we want to predict in this challenge. “+1” is for the Time Period column.
-
-
A report about your model, including data analysis, model details, local cross validation results, and variable importance.
-
A deployment instructions about how to install required libs and how to run.
Expected in Submission
-
Working Python code which works on the different sets of data in the same format
-
Report with clear explanation of all the steps taken to solve the challenge (refer section “Challenge Details”) and on how to run the code
-
No hardcoding (e.g., column names, possible values of each column, ...) in the code is allowed. We will run the code on some different datasets
-
All models in one code with clear inline comments
-
Flexibility to extend the code to forecast for additional months
Quantitative Scoring
Given two values, one ground truth value (gt) and one predicted value (pred), we define the relative error as:
MAPE(gt, pred) = |gt - pred| / gt
We then compute the raw_score(gt, pred) as
raw_score(gt, pred) = max{ 0, 1 - MAPE(gt, pred) }
That is, if the relative error exceeds 100%, you will receive a zero score in this case.
The final MAPE score for each variable is computed based on the average of raw_score, and then multiplied by 100.
Final score = 100 * average( raw_score(gt, pred) )
MAPE scores will be 50% of the total scoring.
You will also receive a score between 0 and 1 for all the thresholds and targets that you achieve. Each threshold will be worth 0.033 points and each target will be worth 0.05 points. Obviously if you achieve the target for a particular variable you’ll get the threshold points as well so you’ll receive 0.083 points for that variable. Your points for all the variables will be added together.
Judging Criteria
Your solution will be evaluated in a hybrid of quantitative and qualitative way.
-
Effectiveness (80%)
-
We will evaluate your forecasts by comparing it to the ground truth data. Please check the “Quantitative Scoring” section for details.
-
The smaller MAPE the better.
-
Please review the targets and thresholds above as these will be included in the scoring.
-
-
Clarity (10%)
-
The model is clearly described, with reasonable justifications about the choice.
-
-
Reproducibility (10%)
-
The results must be reproducible. We understand that there might be some randomness for ML models, but please try your best to keep the results the same or at least similar across different runs.
-