Challenge Overview
Challenge Objective
The objective of this challenge is to generate time-series forecasts with the highest accuracy predictions possible for the financial variables outlined below.
The accuracy of the forecast must at least improve on the Target performance quoted for each variable (targets based on the models sourced from preliminary investigations); and must be Robust so as to be stable over a 6 month period.
The model should be tailored to a 12-mth forecast horizon but must be extendable beyond this time period.
The accuracy of a prediction will be evaluated using two criteria:
-
MAPE (Mean Absolute Percentage Error) on the privatised data set over a period of 6 months from October 2019 - March 2020
-
Robustness (NEW) as measured by minimising RMSE over 6 iterations of a 6 month prediction window starting from Oct ‘19 - Mar ‘20
Introduction
A Mobile network, to be known as Sandesh, is looking to create a high quality, high accuracy time-series forecast for 4 key Financial metrics for their Brand 3 brand across two products.
The products are:
-
Leopard - Handset, SIM card, and Airtime contract sold together
-
Panther - Only SIM card, and Airtime contract sold together
The target variables are financial metrics
-
Leavers - the number of subscribers per individual product who terminated service with the brand during that month. This is required for both Leopard and Panther products.
-
Gross adds - the number of new subscribers to each individual product joining the brand during a month. This is only required for Panther product.
-
Closing Base - the number of subscribers to an individual product at the end of each month. This is only required for Panther product.
Business Insight
Financial Year modeling:
Sandesh reports its financial year from April - March. This may contribute to seasonality based on financial year, and quarters (Jun, Sep, Dec, and Mar), rather than calendar year.
Anonymised and Privatised data set:
‘Z-score’ is used to privatise the real data.
For all the variables, following is the formula used to privatise the data:
zi = (xi – μ) / σ
where zi = z-score of the ith value for the given variable
xi = actual value
μ = mean of the given variable
σ = standard deviation for the given variable
Targets on Privatised data
These Targets are best on the performance of crude models generated during preliminary investigations.

Your submission will be judged on three criteria.
-
Minimizing error (MAPE)
-
Achieving the Targets designated in the tables above.
-
Minimising RMSE on the ‘6 month / 6 window’ Robustness measure’
It is recommended to optimise the models to minimise RMSE, as opposed to MAPE. The privatisation method used (see section earlier) can distort the error analysis.
The complete evaluation criteria and scoring mechanic will be outlined in the Quantitative Scoring section below.
Modeling Insight - Robustness calculation
Once the model has been built, Robustness of the model should be calculated in the following way.
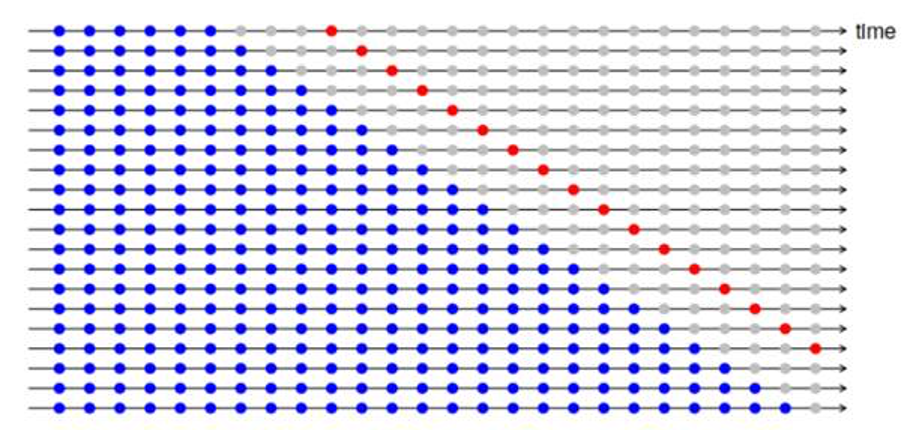
The evaluation is done based on a rolling forecast from the start of the final prediction. This can be most easily demonstrated in the diagram below:
- every horizontal line represents one time iteration
- Blue points represent the training window back to start of the data set
- (grey+red) points represent the forecasting/ prediction window. In this diagram h, the prediction window =4.
Once all the iterations are done, RMSE should be calculated for all values of h from 1 to end of the prediction window.
For example, when h=1, calculate the RMSE for the first forecasted point in all iterations. With h=2, calculate the RMSE for the second forecasted point in all iterations.
Then plot the RMSE values for each point in the forecast window. For more details https://otexts.com/fpp2/accuracy.html can be visited - see section titled ‘Time-Series cross validation’.
For this challenge
Robustness
-
The forecasting/ prediction window must be 6 months
-
There must be 6 iterations of the forecast starting from October ‘19, and rolling back in one month increments to May ‘19. This will generate the 6 iterations.
-
6 RMSE values must be plotted against the forecasted periods.
-
For every variable, a graph consisting of RMSE on y-axis and Forecast period (i.e. h=1, 2 etc) on x-axis must be submitted.
-
MAPE
-
MAPE for the final prediction forecast from Oct ‘19 - Mar ‘20
Both the criteria will be used for selection of the best model.
Confidence intervals for the forecasting period, should also be submitted.
Final Submission Guidelines
Submission Format
You submission must include the following items
-
The filled test data. We will evaluate the results quantitatively (See below)
-
Please use Time Period, Generic Keys as the column names.
-
The values in Time Period column are something like 2019-08
-
The values in each Generic Key column is the predicted values, i.e., floating numbers.
-
The final spreadsheet has a Nx(M+1) shape, where N is the number of time periods and M is the number of variables that we want to predict in this challenge. “+1” is for the Time Period column.
-
-
A report about your model, including data analysis, model details, local cross validation results, and variable importance.
-
A robustness plot and their values. Please refer to the robustness definition for details. You shall be able to calculate it locally.
-
A deployment instruction about how to install required libs and how to run.
Expected in Submission
-
Working Python code which works on the different sets of data in the same format
-
Report with clear explanation of all the steps taken to solve the challenge (refer section “Challenge Details”) and on how to run the code
-
No hardcoding (e.g., column names, possible values of each column, ...) in the code is allowed. We will run the code on some different datasets
-
All models in one code with clear inline comments
-
Flexibility to extend the code to forecast for additional months
Quantitative Scoring
Given two values, one ground truth value (gt) and one predicted value (pred), we define the relative error as:
MAPE(gt, pred) = |gt - pred| / gt
We then compute the raw_score(gt, pred) as
raw_score(gt, pred) = max{ 0, 1 - MAPE(gt, pred) }
That is, if the relative error exceeds 100%, you will receive a zero score in this case.
The final MAPE score for each variable is computed based on the average of raw_score, and then multiplied by 100.
Final score = 100 * average( raw_score(gt, pred) )
MAPE scores will be 50% of the total scoring.
You will also receive a score between 0 and 1 for all the targets that you achieve. Each target will be worth 0.25 points. Your points for all the variables will be added together.
Judging Criteria
Your solution will be evaluated in a hybrid of quantitative and qualitative way.
-
Effectiveness (80%)
-
We will evaluate your forecasts by comparing it to the ground truth data. Please check the “Quantitative Scoring” section for details.
-
The smaller MAPE the better.
-
Please review the targets and thresholds above as these will be included in the scoring.
-
We will also check the robustness score and use it to rank the submissions with close MAPE and threshold scores.
-
-
Clarity (10%)
-
The model is clearly described, with reasonable justifications about the choice.
-
-
Reproducibility (10%)
-
The results must be reproducible. We understand that there might be some randomness for ML models, but please try your best to keep the results the same or at least similar across different runs.
-