Challenge Overview
Introduction & Background
Over the last few months, a series of challenges have been run to generate a series of high quality financial forecasts for a consumer telecommunications provider, ‘Sandesh’. These challenges have been known as ‘CFO Forecasting’ in various formats. As a result, a high quality, high accuracy series of algorithmic forecasts have been produced for a number of financial target variables.
This new challenge is being initiated to generate similar high quality forecasts for a subscription based Entertainment over IP service and a group of pay television sports channels offered by Sandesh.
Challenge Objective
The objective of this challenge is to generate the highest accuracy predictions possible for the 9 financial variables outlined below across two products. The accuracy of the forecast must at least improve on the Threshold targets quoted for each variable on each product.
The model should be tailored to a 12-mth forecast horizon but must be extendable beyond this time period.
Your submission will be evaluated using the following criteria:
-
MAPE (Mean Absolute Percentage Error) of the predictions on the privatised data set over a period of 6 months from October 2019 - March 2020. (See further details in the scoring section)
-
Robustness: Robustness testing and results required in submission. (See Appendix for methodology).
-
Acceptance Criteria: Full conformance required to ‘Acceptance Criteria for Submission’ (see full details in the appropriate section.)
Business Context
The two products are:
-
Sandesh Entertainment over IP - a subscription based television service
-
Sandesh requires customers to sign up to their Broadband and Phone Line services to use Entertainment over IP.
-
-
Sandesh Sport - a group of paid subscription based television sports channels
-
Sandesh Sport is available on the Sandesh Entertainment over IP platform, and can also be accessed via a mobile app as well as on some of Sandesh’s competitors television platforms. Target variables for Sandesh Sport are based on aggregated data across these access platforms.
-
The 4 target variables for Sandesh Entertainment over IP are financial metrics:
-
Gross Adds – the number of new subscribers joining the brand during a month
-
Leavers - the number of subscribers who terminated service with the brand during that month.
-
Closing Base – the number of subscribers to the product at the end of each month
-
Subscription Revenue – the total revenue generated by the subscriber base for the product per month.
The 5 target variables for Sandesh Sport are financial metrics:
-
Gross Adds – the number of new residential customers joining the brand during a month
-
Leavers - the number of residential customers who terminated service with the brand during that month.
-
Closing Base – the number of residential customers with the brand at the end of each month
-
Revenue (Total) – the total revenue generated by all customers of this product per month.
-
Residential Revenue – the revenue generated by residential customers of this product per month.
Business Insight
Sandesh Sport holds exclusive live television rights to a number of popular sporting competitions which drive revenues due to high demand from subscribers and other users.
As Sandesh has exclusive rights to these competitions, the dates that these sporting events occur may contribute to seasonality in the data. We have provided data sets to represent the broadcast dates for each of the competitions below that can be used as exogenous variables to use for prediction in your model.
Each exogenous variable representing a competition has been plotted in the diagrams below against both the residential revenue and total revenue for Sandesh Sport.
-
Top National League (Football)

-
Top Regional Winners League (Football)

-
Top National Rugby

-
Regional Champions Cup (Rugby)
Financial Year modeling
Talaria reports its financial year from April - March. This may contribute to seasonality based on financial year, and quarters (Jun, Sep, Dec, and Mar), rather than calendar year.
Anonymised and Privatised data set
‘Z-score’ is used to privatise the real data.
For all the variables, following is the formula used to privatise the data:
zi = (xi – μ) / σ
where zi = z-score of the ith value for the given variable
xi = actual value
μ = mean of the given variable
σ = standard deviation for the given variable
Thresholds and Targets
The performance of the models on privatised data is not directly correlated with performance on real data. These Thresholds and Targets have been generated using the foundation models described below.
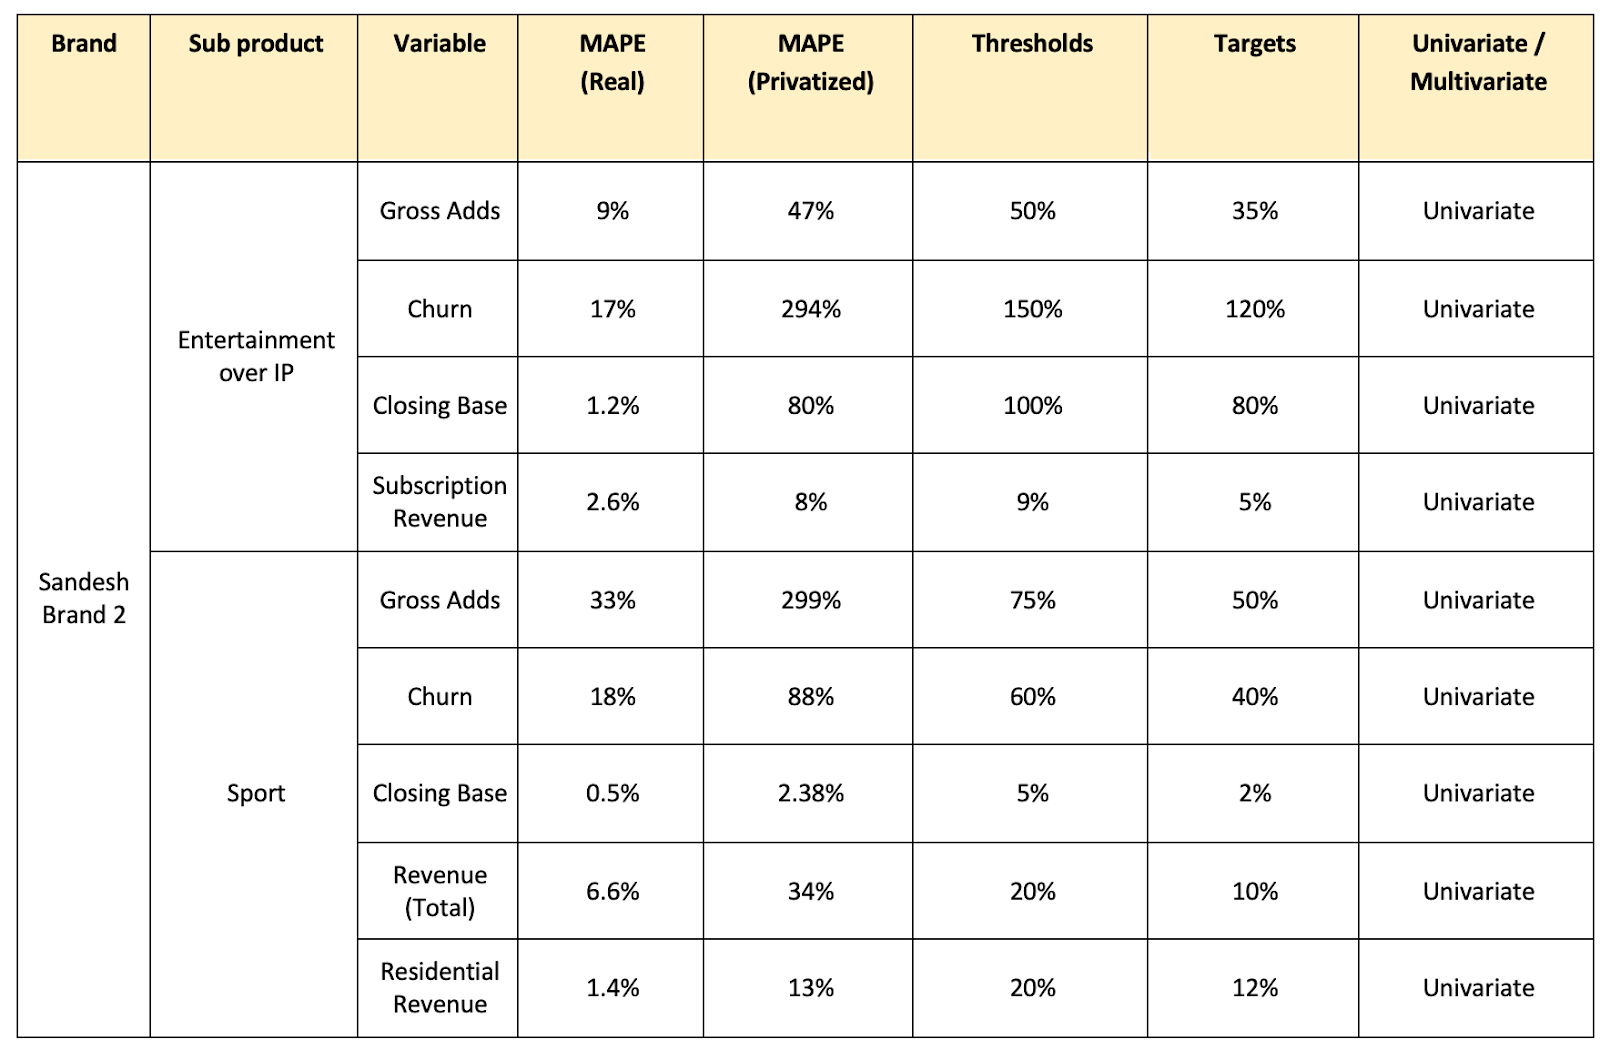
Your submission will be judged on two criteria.
-
Minimizing error (MAPE).
-
Achieving the Thresholds and Targets designated in the tables above.
The full evaluation criteria will be outlined in the Quantitative Scoring section below.
Final Submission Guidelines
Submission Format
You submission must include the following items
-
One prediction file over the forecast time period (Oct19 – March20). We will evaluate the results quantitatively (See below). Please stick to the following prediction file format.
-
Please use Time Period, Generic Keys as the column names.
-
The values in Time Period column are something like 2019-10
-
The values in each Generic Key column is the predicted values, i.e., floating numbers.
-
The final spreadsheet has a Nx(M+1) shape, where N is the number of time periods and M is the number of variables that we want to predict in this challenge. “+1” is for the Time Period column.
-
-
A report about your model, including data analysis, model details, local cross validation results, and variable importance.
-
A deployment instructions about how to install required libs and how to run.
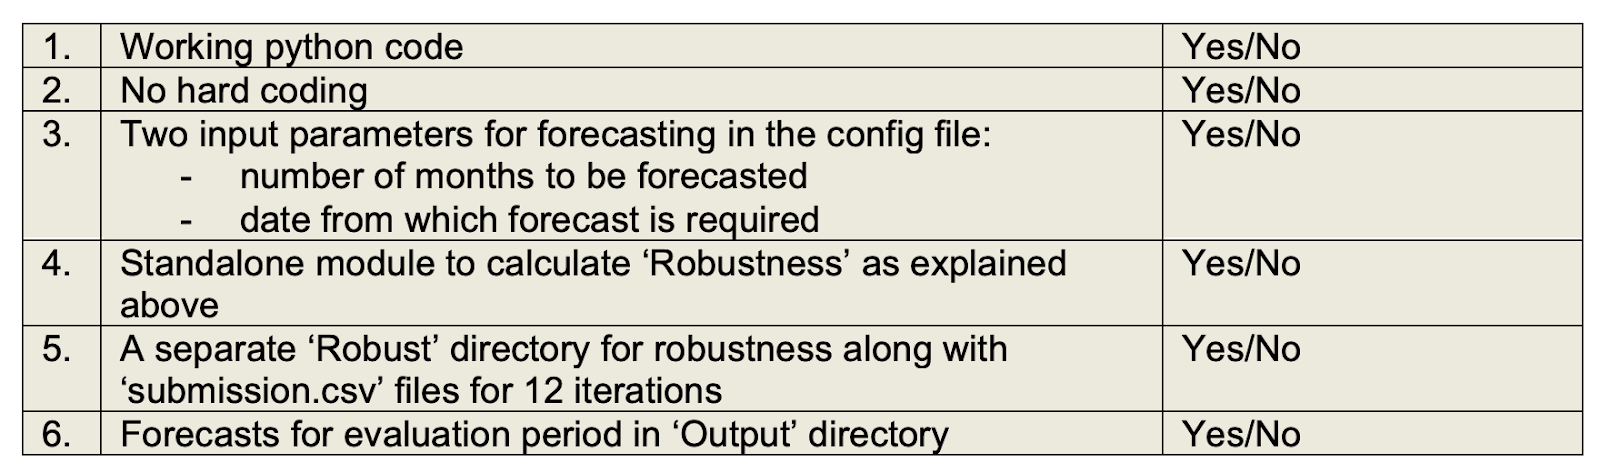
Acceptance criteria for Submission
-
Working Python code (could be Jupyter-Notebook) which works on the different sets of data in the same format
-
Report with a clear explanation of all the steps taken to solve the challenge (refer section “Challenge Details”) and on how to run the code.
-
No hardcoding (e.g., the hyper-parameters of your model cannot be hardcoded. It must be adaptive to the training set.) in the code is allowed. We will run the code on some different datasets
-
All models in one code with clear inline comments
-
Flexibility to extend the code to forecast for additional months
-
Python code to include Robustness Testing as explained below:
Quantitative Scoring
MAPE on Prediction Window
Given two values, one ground truth value (gt) and one predicted value (pred), we define the relative error as:
MAPE(gt, pred) = |gt - pred| / gt
We then compute the raw_score(gt, pred) as
raw_score(gt, pred) = max{ 0, 1 - MAPE(gt, pred) }
That is, if the relative error exceeds 100%, you will receive a zero score in this case.
The final MAPE score for each variable is computed based on the average of raw_score, and then multiplied by 100.
Final MAPE score = 100 * average( raw_score(gt, pred) )
You will also receive a score between 0 and 1 for all the thresholds and targets that you achieve. Each threshold will be worth 0.033 points and each target will be worth 0.05 points. Obviously if you achieve the target for a particular variable you’ll get the threshold points as well so you’ll receive 0.083 points for that variable. Your points for all the variables will be added together.
Judging Criteria
Your solution will be evaluated in a hybrid of quantitative and qualitative way.
-
Effectiveness (80%)
-
We will evaluate your forecasts by comparing it to the ground truth data. Please check the “Quantitative Scoring” section for details.
-
The smaller MAPE the better.
-
Please review the targets and thresholds above as these will be included in the scoring.
-
-
Clarity (10%)
-
The model is clearly described, with reasonable justifications about the choice.
-
-
Reproducibility (10%)
-
The results must be reproducible. We understand that there might be some randomness for ML models, but please try your best to keep the results the same or at least similar across different runs.
-
Checklist for Submission
Please ensure to fill-up and submit following table along with the submission:
Appendix
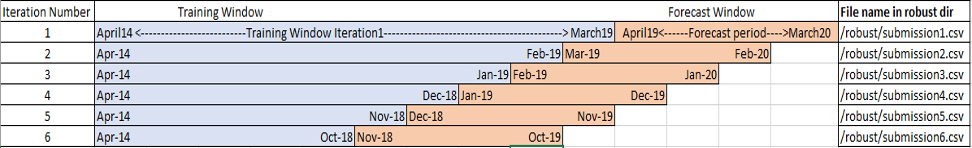
Robustness testing methodology
Once model building is done, robustness of the model has to be calculated. Robustness evaluation is done on a rolling forecasting from origin. See the below image for the details.
(This is just a sample image. Dates may change for the training and forecasting horizon and are mentioned in point no. 6 below)
-
Every horizontal line represents one iteration.
-
Blue windows are training period and Orange windows are Forecasting period.
-
One separate directory to be created with the name “/Robust” to store the forecast for all the iterations.
-
Forecast to be saved in a .csv file with the name ‘submission’ affixed with the iteration number e.g. name of .csv file to be ‘submission1’. Inside the file submission.csv, please ensure that the variables that are being forecasted should be stacked horizontally. Please refer below table for a better understanding:

-
Separate python function/module to be created, which will call the model to generate the forecast for different periods as explained in the above image. This is required for code modularity. This function should be parameterized with a boolean parameter so that we can run the code with or without robustness testing
-
The function/module for the robustness, should have below input parameters.
-
Start date of the training window of the iteration 1. (April 2019)
-
End Date of the training window of the iteration 1. (March 2020)
-
Forecast period i.e. number of months to forecasts. (12 months)
-
Number of iterations. (12 iterations to be done)
-
For subsequent iteration Train/Forecast start and end month should be automatically calculated based on the input given in step a) and b) as shown in the above image.
-
-
While running this module, you should use the final model based on training data till September 2019. For example if it’s an ARIMA model then p, d, q values should be the same throughout all the iterations. If it’s a LSTM then hyper-parameters such as epochs, number of LSTM units, look back/look forward etc. should be the same as your final model built for date range mentioned in point 8. All the iterations should run on the same parameter configuration. All these final hyper-parameters to be stored in a config file. And this config file should be used to run the robustness testing
-
Robustness will be calculated based on MAPE over 12 iterations.