Challenge Overview
Introduction
Welcome all attendees to TCO20 Southern Asia Regionals. We are excited to have DigitalOcean as our cloud partner for today’s event. This development challenge is sponsored by DigitalOcean. Other than the cash prizes the winners will also be awarded $500 DigitalOcean credits and some gift vouchers to buy DigitalOcean swag.
Overview
The challenge will require you to build an application and host it on DigitalOcean.
The challenge is made of several levels. Level 1 to Level 4 to be precise. Start from Level 1 and move upwards. Each Level has different points which are detailed below, and the difficulties are increasing gradually.
We will provide Topcoder API and competitors can get past challenges and member info from them. In each level, they need to build a web app and show some charts for data visualization. If they deploy the web app to DigitalOcean and share the link, they can earn some bonus points.
Each developer can only build one web app, it means the functionalities of all levels should be integrated in a single web app.
All the levels will be run at the same time. Competitors can pick any level to start and earn the points. They will be ranked by the total points that they earned.
Topcoder API details
We will provide two sets of Topcoder API
-
Topcoder challenge API (v5): you can get the challenge details from it. Here is the online swagger spec: http://api.topcoder-dev.com/v5/challenges/docs/
-
Topcoder member API (v3): you can get the member profile details from it. The swagger spec and Postman collection is attached in the challenge forum.
Documentation
The following links will be useful about how to get started with DigitalOcean. (DO)
Level 1 - Build a pie chart (10 points)
In this level, you are required to build a pie chart to visualize the prize distribution of the past challenges. The prize ranges are
-
< $200
-
$200 (inclusive) - $400 (exclusive)
-
$400 (inclusive) - $800 (exclusive)
-
$800 (inclusive) - $1200 (exclusive)
-
>= $1200
Only the challenges of the DEVELOP track Code subtrack are counted.
Each slice of the pie chart represents a price range, and the value is the percentage of the challenges in the given time frame.
For the percentage, round the value to 1 decimal. For example, 13.42 should be rounded to 13.4, 15.67 should be round to 15.7.
The pie chart should include labels and legends.
To query the challenges in a given time frame, check the startDateStart and startDateEnd parameter of GET https://api.topcoder.com/v5/challenges API.
Below it is an example for your reference, you don’t have to follow the style of the example strictly, but your pie chart should contain all the required elements.

The web app should allow users to input the time frame (start date and end date), then it renders the pie chart in the app.
Level 2 - Build a bar chart (20 points)
In this level, you are required to build a bar chart to visualize the number of past challenges in different technologies. If a challenge includes more than one technology, count it in all the included technologies. For example, if the technologies (tags) of a challenge are Typescript, Angular 2+, count it in both Typescript and Angular 2+.
Only the challenges of the DEVELOP track Code subtrack are counted.
The bar chart should include labels.
To query the challenges in a given time frame, check the startDateStart and startDateEnd parameter of GET https://api.topcoder.com/v5/challenges API.
Below it is an example for your reference, you don’t have to follow the style of the example strictly, but your bar chart should contain all the required elements.
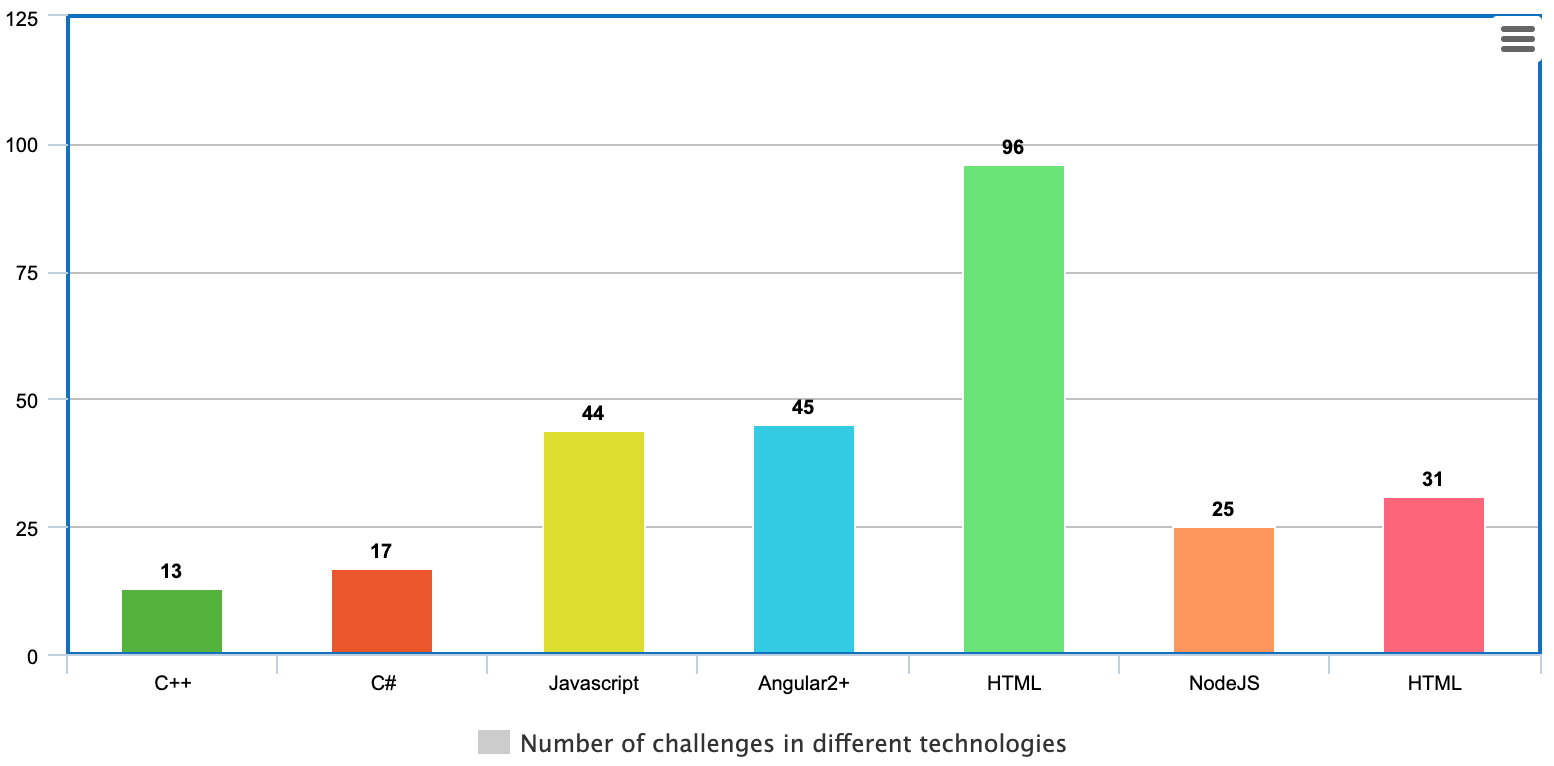
The web app should allow users to input the time frame (start date and end date), then it renders the bar chart in the app.
Level 3 - Build a scatter plot with linear regression estimation (50 points)
In this level, you are required to build a scatter plot to visualize the number of past challenges in a given technology, draw a best fit line with linear regression to show the trend of the number of challenges in this technology in the future.
Only the challenges of the DEVELOP track Code subtrack that are started since Jan 1st, 2018 are counted.
The x axis of the scatter plot is the number of days since Jan 1st, 2018.
The y axis of the scatter plot is the number of challenges.
The scatter plot samples data every 30 days.
For example,
On Jan 1, 2018 - Jan 30, 2018, there are 16 NodeJS challenges, then the value of sample 1 is 16;
On Jan 31, 2018 - Mar 1, 2018, there are 22 NodeJS challenges, then the value of sample 2 is 22;
On Mar 2, 2018 - Apr 1, 2018, there are 14 NodeJS challenges, then the value of sample 3 is 14;
…
Then the scatter plot should show like below
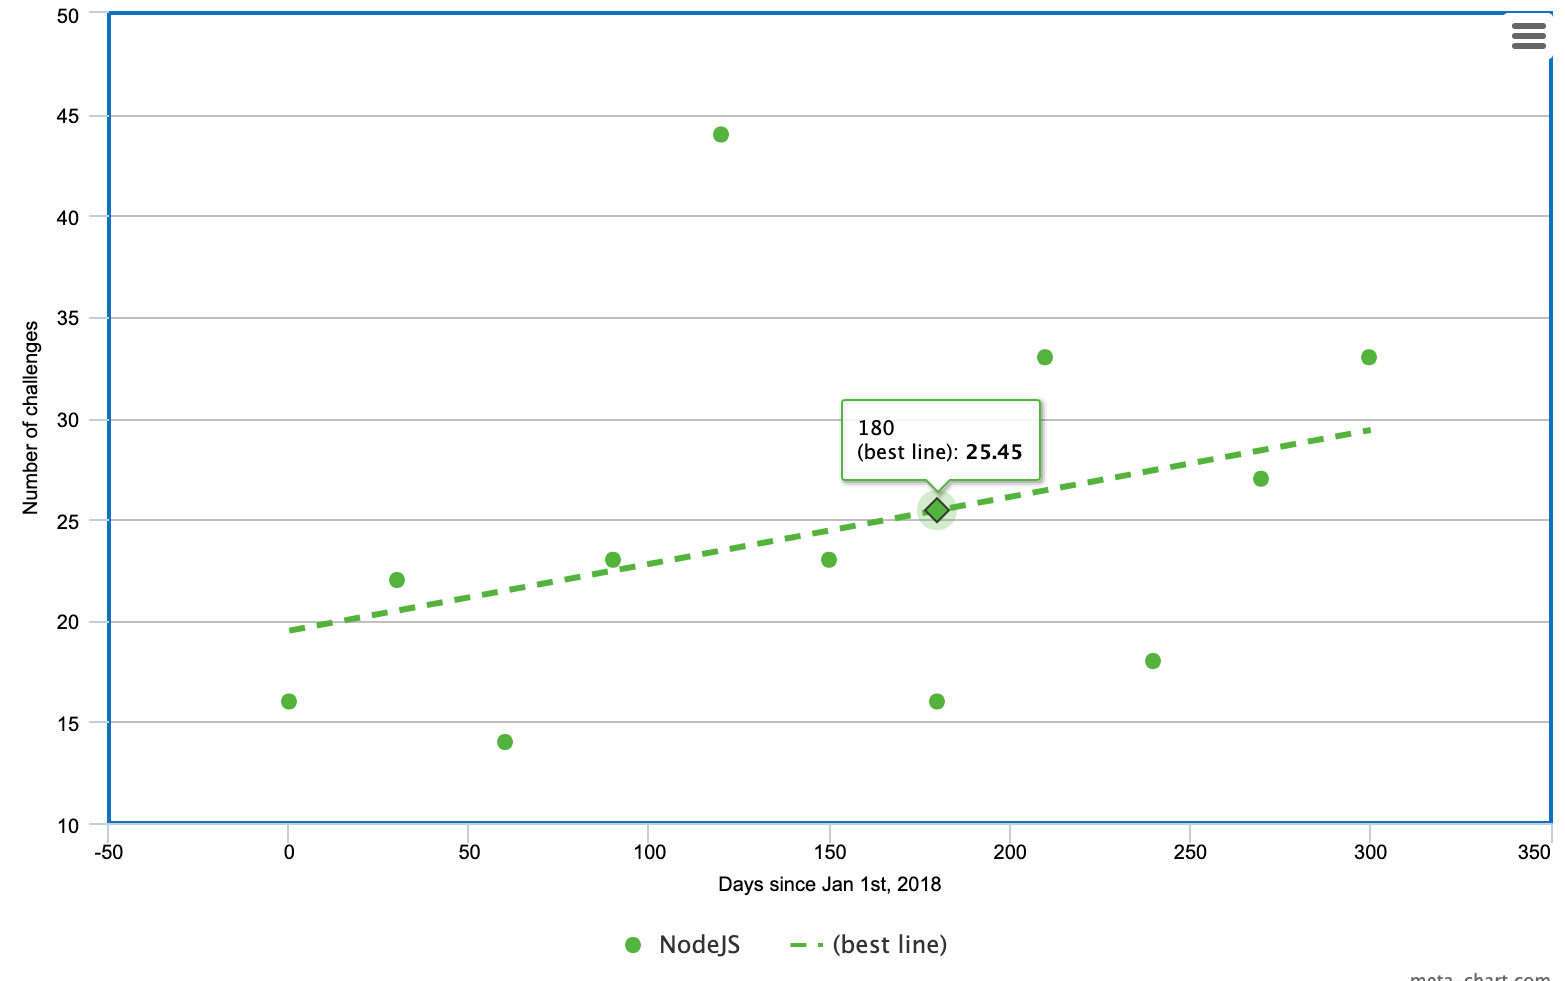
The scatter plot should include
-
Labels.
-
Best fit line
-
Legends
Note you don’t have to follow the style of the example strictly, but your scatter plot chart should contain all the required elements.
You should also output
-
Equation of the linear regression: Regression line equation: y = a + b * x, where a is the intercept, b is the slope. For example, the regression line equation should be output as y=0.933+1.186x, round a and b to 3 decimal places.
-
The estimated number of challenges in 30 days since July 19th, 2020. For example, July 19th, 2020 is 930 days from Jan 1st, 2018.
The web app should allow users to input the time frame (start date and end date), then it renders the following in the app
-
the scatter plot in the app,
-
the equation of the linear regression
-
the estimated number of challenges in 30 days since July 19th, 2020
Level 4 - Build a world map chart for challenge winners of different countries (100 points)
In this level, you are required to build a world map chart to show the winners of each country, the map should be interactive.
-
Only the winners of the challenges in DEVELOP track are counted, ignoring other tracks.
-
By default, the challenges should start since Jan 1st, 2018. The start date and end date should be configurable.
-
By hovering each country, there should pop up a tip text with the country name and the number of the winners of this country.
-
By clicking on the country on the map, there should pop up a modal with a list of the handles of the winners.

By clicking on the handle of the winners, it should navigate to a page that shows the details of the members, the details should include
-
Member handle
-
Country
-
Skills
-
Verified (Source is from the challenge)
-
Not verified (Source is from the user-added)
-
-
External accounts
-
Behance
-
Bitbucket
-
Dribbble
-
GitHub
-
LinkedIn
-
Stack Overflow
-
Twitter
-
-
Rating
-
Code
-
Assembly
-
Development (Component)
-
SRM
-
You can design the layout of this page freely, it is not required to be fancy but should be looking good and responsive.
Bonus - (10 points)
If you deploy your web app to DigitalOcean and share the application URL, you can get 10 points as a bonus.
Final Submission Guidelines
-
You can submit in as many levels as you like. Each Level will be judged separately from others.
-
Please mention which levels you finished in your README.
-
Please zip all the following content in a zip archive, and submit in the Challenge Submission area.
-
The source code of your submission
-
A thorough deployment guide of your submission, please note we only have 1 hour to review, so if we can’t merely follow your deployment guide to deploying your submission, your submission will be disqualified.
-
A simple README of your submission, to give an overview of your submission, including what kind of app you made, what info does it show?
-
Some screencasts or a demo video to showcase your submission (Not mandatory but might be a plus, because it’s helpful for the reviewer to review)
-